Download JMeter
Start JMeter:
C:
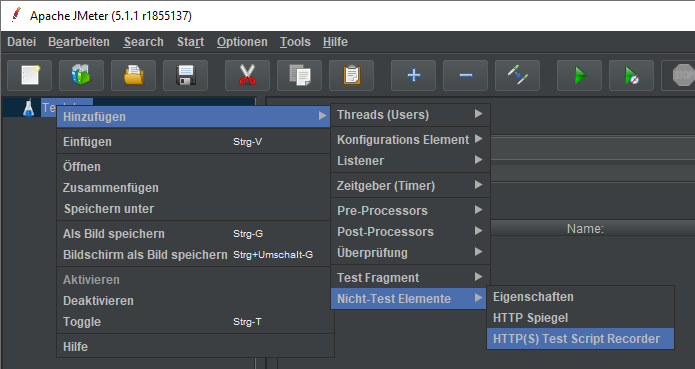
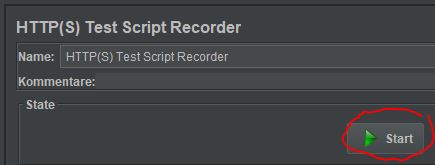
HTTP(S) Test Script Recorder
To test a website’s performance with JMeter, we first need to record the workflow (request/response). Recording the workflow over an HTTPS connection is done as follows:

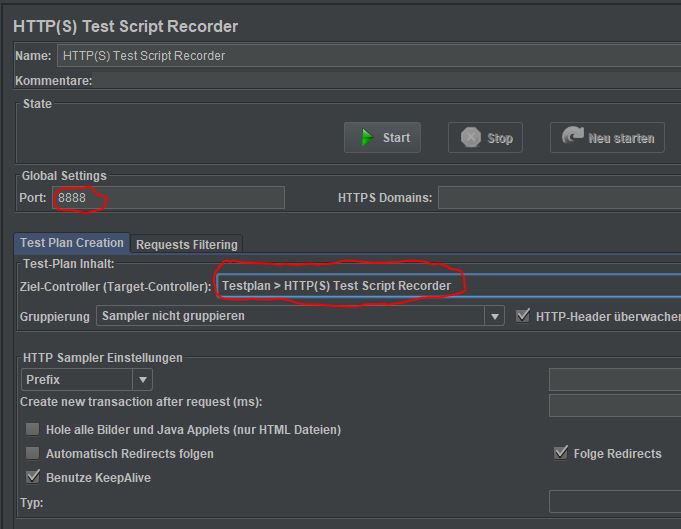
JMeter provides a proxy server that listens on port 8888 by default.
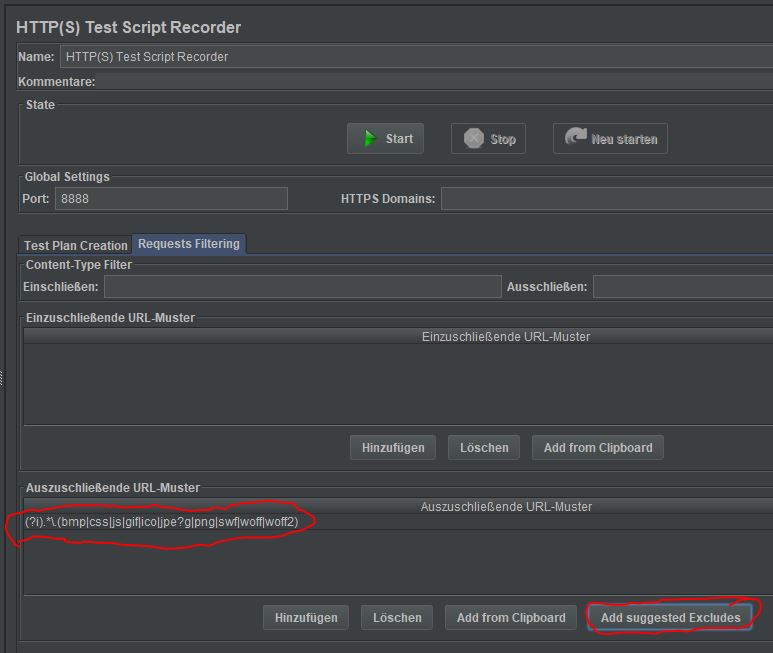
Since we are not interested in images, CSS files, etc., we exclude these:
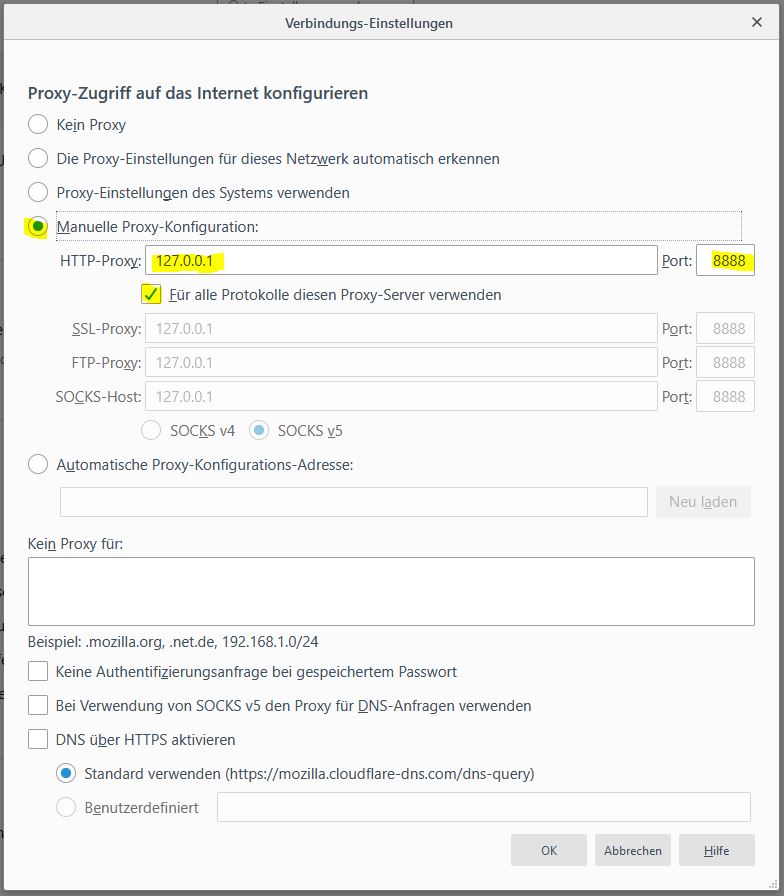
Since JMeter listens on port 8888, we need to forward internet traffic to the local proxy server:
Calling websites will no longer work now. We can only visit a website once we start the recorder:
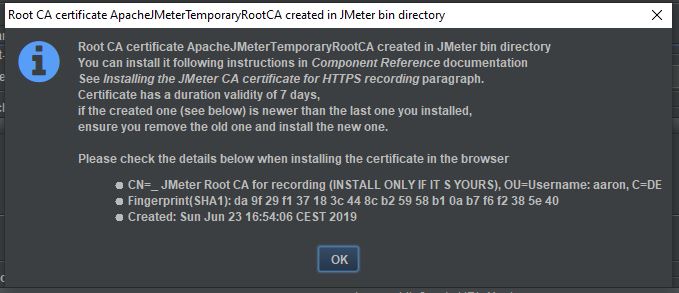
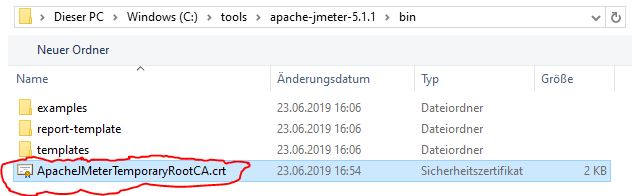
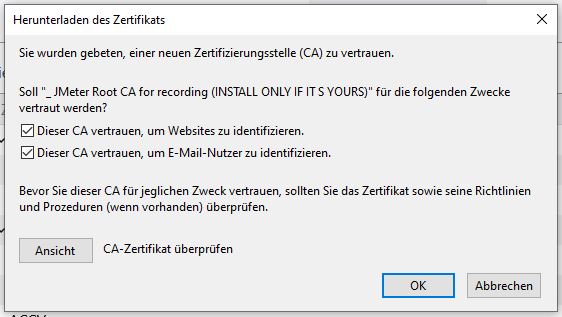
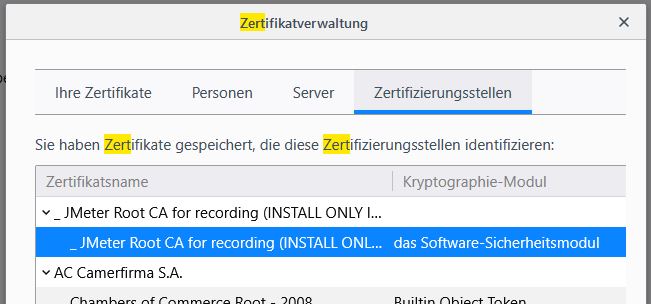
When starting, a JMeter root certificate is created, which is valid for days. The certificate is placed in JMeter’s bin folder and must then be imported into the browser:
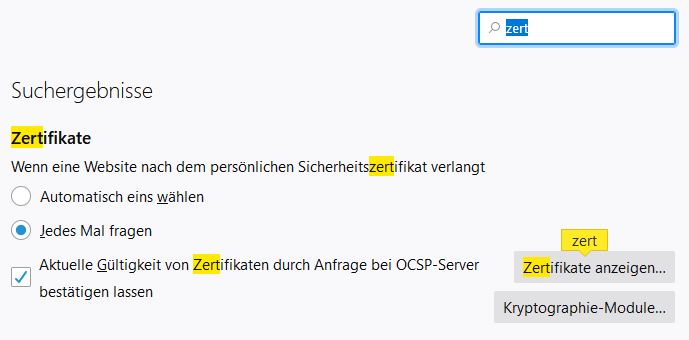
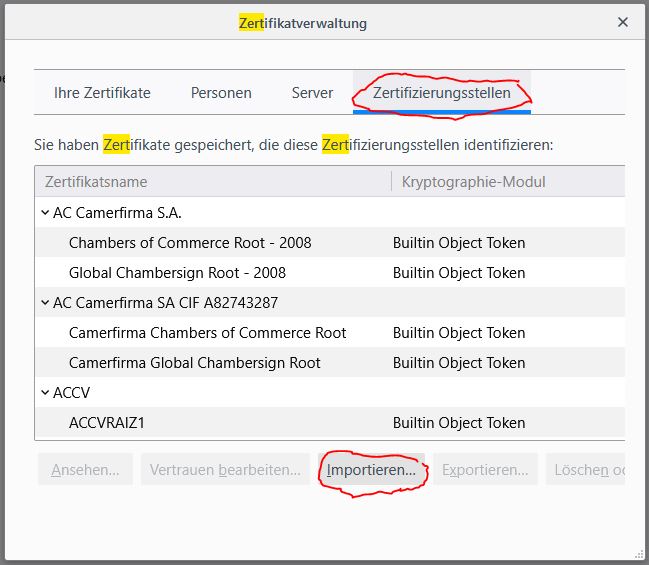
In Firefox, the import is done under “View Certificates -> Authorities -> Import”:
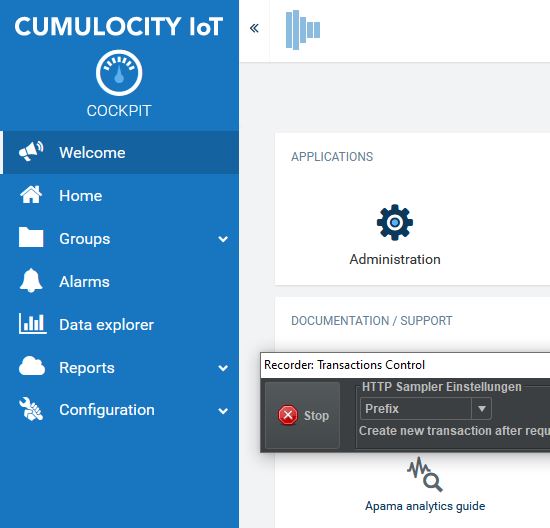
The recorder is running, and we can start the first recording. At this point, I want to record the login on a website:
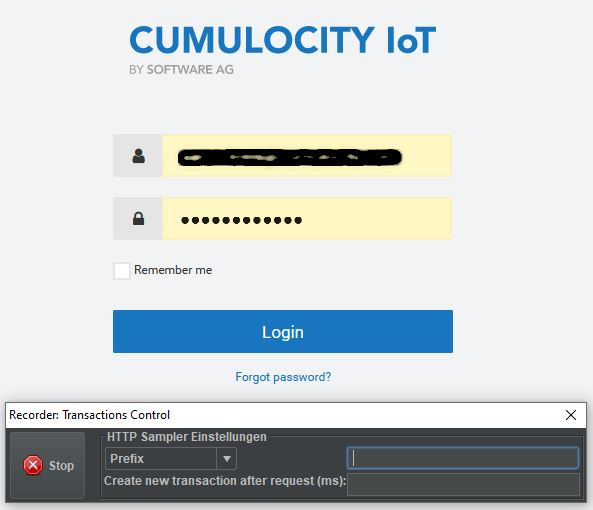
As you can see in the figure, after starting JMeter opens the above Transactions Control popup, which we can ignore for now. The recording is completed as soon as we click the Stop button.
After successful login, the welcome page is displayed:
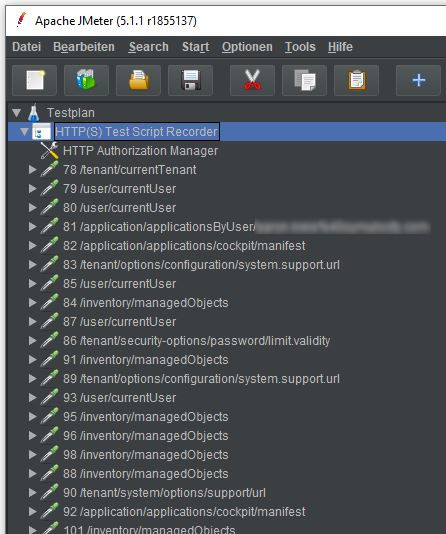
The recording is then displayed inside JMeter:
BlazeMeter
It is also possible to record using BlazeMeter and then import this into JMeter (drag & drop). This has the advantage that you don’t have to set up the proxy. In addition, BlazeMeter recordings are leaner because unnecessary traffic is filtered out. BlazeMeter also offers browser plugins.
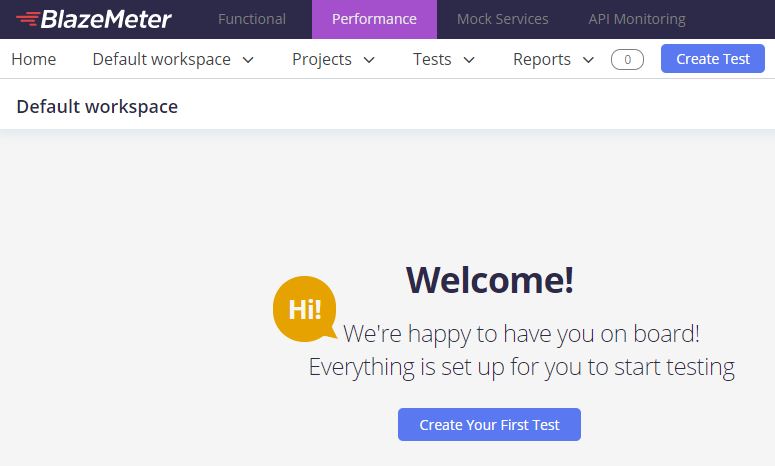
BlazeMeter can be tested at http://blazedemo.com, where you can simulate a flight booking.
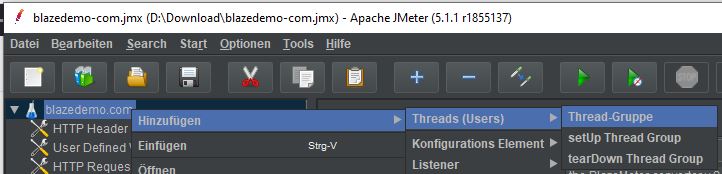
Thread Group
The record from BlazeMeter includes a Thread Group. A thread serves to repeat a recording x times to simulate a real load. If we click play without a Thread Group, we run the recording only once.
A Thread Group is added manually as follows:
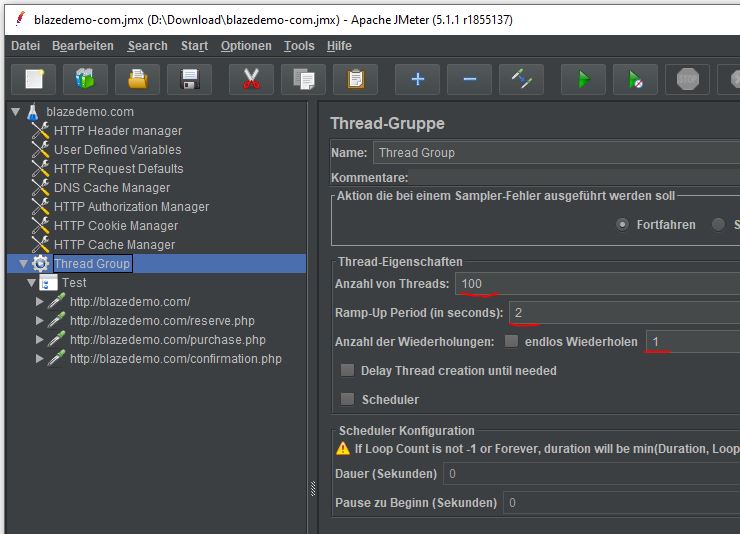
Number of Threads is to be set equal to the number of users. In this case, we want to simulate access by 100 users, i.e. 100 users should execute the recorded workflow.
The 100 users should execute the recording within a time period of 2 seconds, i.e. within 2 seconds, 100 users will execute the workflow. The 1 means that the thread should run only once. If ‘Infinite Loop’ is selected, the 100 users will execute the workflow within 2 sec. and then start again, and then again and again. If ‘Infinite Loop’ is selected, you can specify under ‘Duration (seconds)’ that, for example, at 120 the execution is repeated until the 120 seconds are reached.
Under ‘Action to be taken after a Sampler error…’ you can define what should happen in case of an error, e.g. simply start with the next loop (iteration).

Reporting
Before we start executing the recordings, we need to add one or more listeners to the project. A listener’s task is to generate a report, e.g. Response Time Graph.
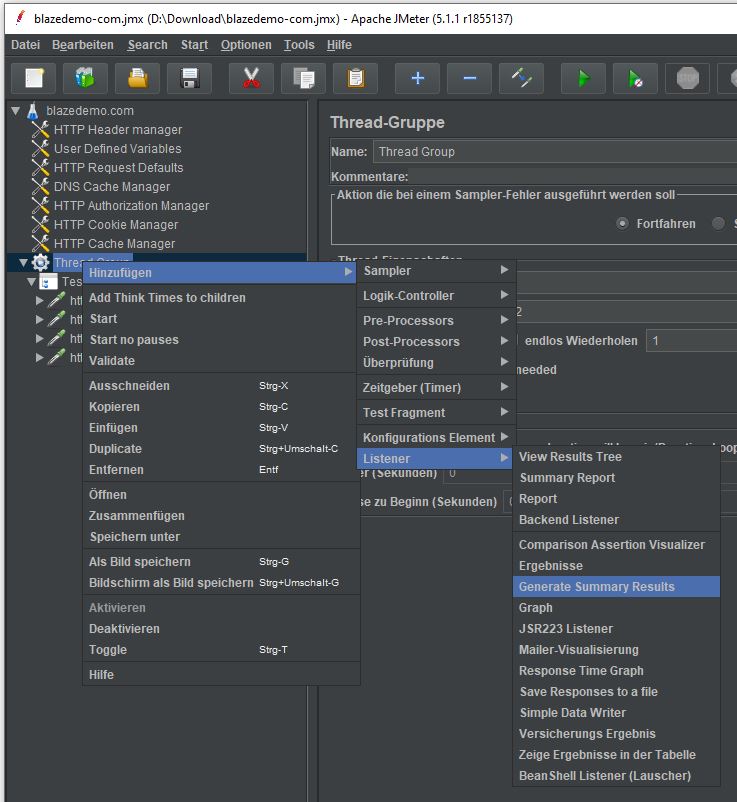
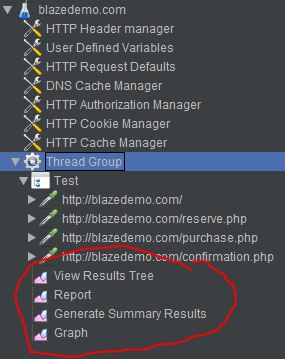
I will add the following listeners:
- View Result Tree
- Report
- Generate Summary Results
- Graph
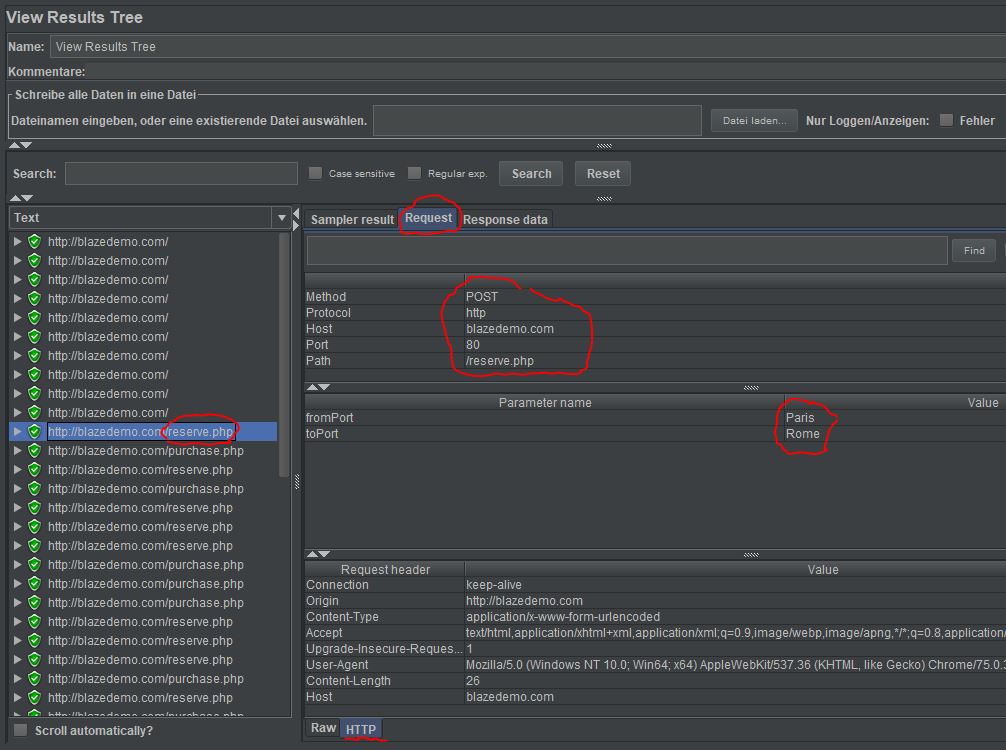
The View Result Tree result shows that there was no faulty communication (green marker). In addition, we get the request/response information displayed:
Report shows the following information:
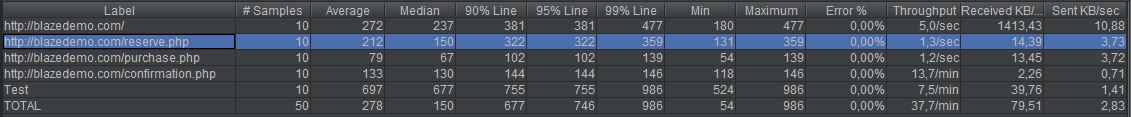
Sample: number of calls to reserve.php (req/resp). In this example, reserve.php was called 10 times, i.e. by 10 users.
Average: the 10 calls took on average 212 milliseconds. For one user, for example, processing took longer than for another.
Median: the median, i.e. the user that the median represents, received a response in 150 milliseconds.
90% Line: 90% of users, i.e. 90% of 10 = 9, received a response in an average of 322 milliseconds. The same information is also shown for 95% and 99%.
Min: the fastest response was received by a user in 131 ms.
Maximum: the longest a user had to wait for a response was 359 ms.
Error %: error rate in %.
Throughput: number of requests a server can process per second, i.e. the server can handle 1.3 req per second.
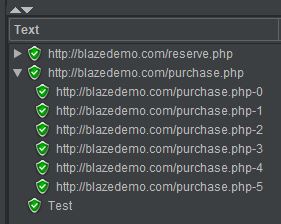
The “View Result Tree” plugin shows two different samples:
- Main Samples: in this case reserve.php and purchase.php.
- Sub-Sample: are the calls underneath, e.g. purchase.php-0.
HTTP Cookie
If you want to save cookies, e.g. login cookies, you can add the necessary Cookie Manager under “Add -> Config Element -> HTTP Cookie Manager”. The addition is done under the corresponding Thread Group.
JMeter Plugins Manager
JMeter can be extended with plugins. You can download these, among others, here: [https://jmeter-plugins.org/]
It is also possible to install the JMeter Plugins Manager, which allows you to install plugins from within JMeter instead of importing them individually.
A few of the most popular plugins are:
- Custom Thread Groups
- Ultimate Thread Group
- Throughput Shaping Timer
- PerfMon Servers Performance Monitoring
- 3 Basic Graphs
Assertion
Using assertions we can specify which results we actually expect, e.g. for a flight booking under http://blazedemo.com I expect after booking the selected flight a response message indicating that my flight from Paris to Rome has been reserved:
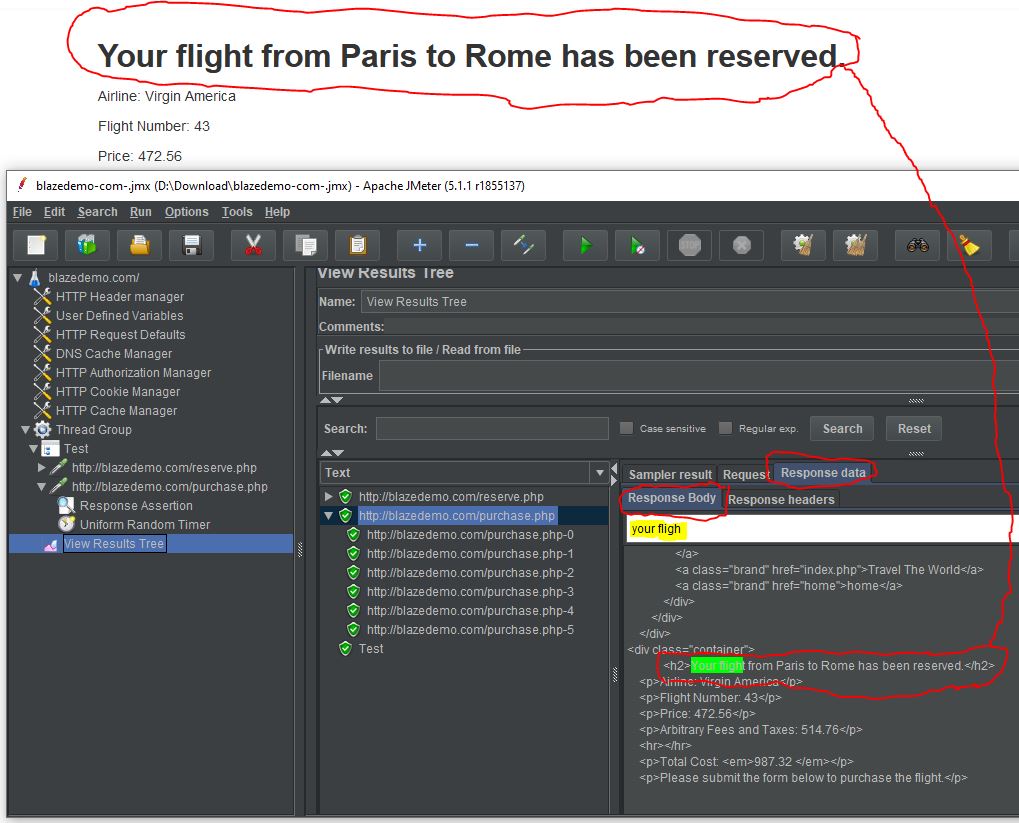
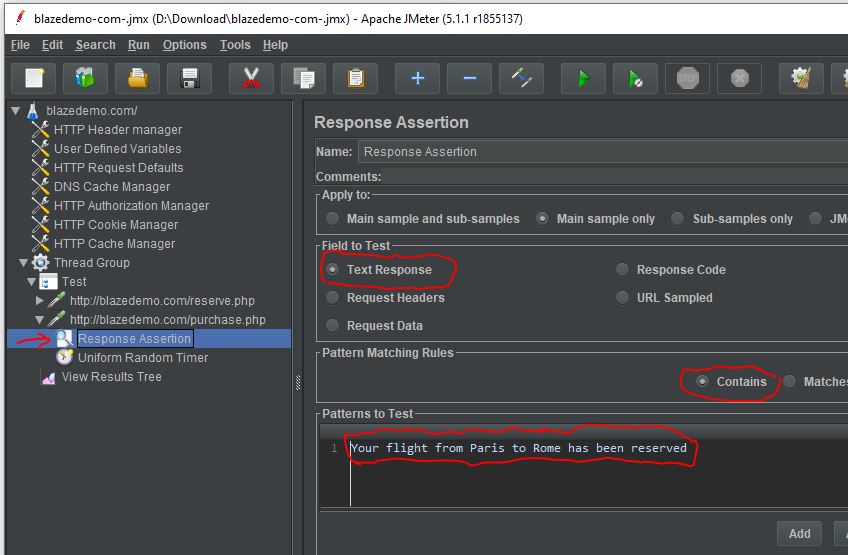
Assertions can be selected under “Add -> Assertions -> Response Assertion”. In this case, I added a Response Assertion.
….