Wireshark is a free program for analyzing and graphically presenting data protocols (sniffer). Such data protocols are used by computers on various communication media such as the local network or USB. Capturing the communication can be useful for troubleshooting or evaluating the content of the communication. Wireshark displays both the protocol headers and the transported content during a capture. The program relies on the output of small helper programs like pcap or usbpcap for the graphical presentation, in order to capture the communication content on the respective transmission medium. [wikipedia]
UI overview 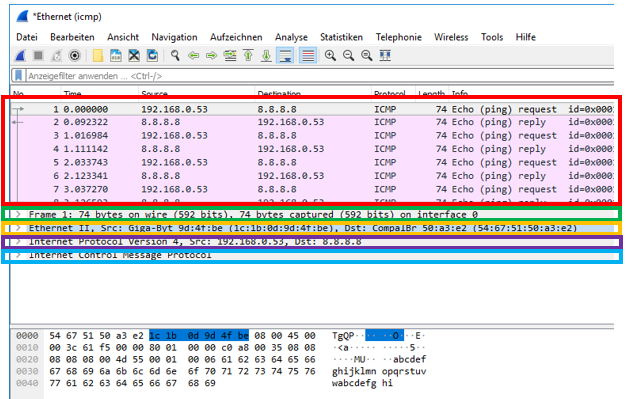 red: list of all frames green: Wireshark summary (not part of the frame) orange: frame header purple: IPv4 protocol information blue: ICMP protocol information
Capture filters
Set up filters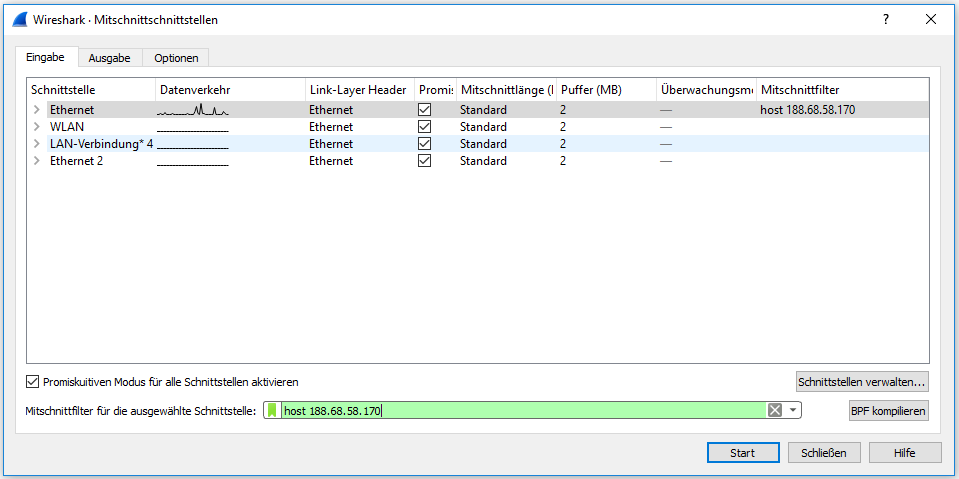
Record request & response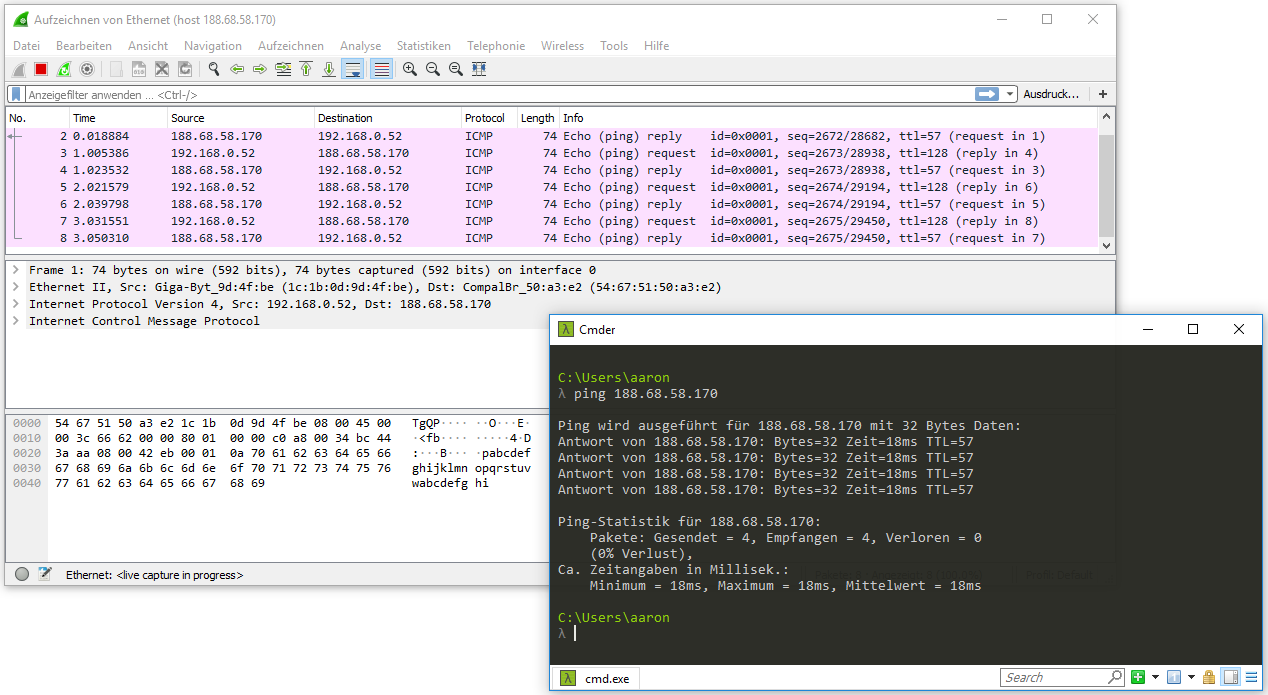
Filter examples:
- Filter to catch incoming frames from a specific IP address: src host
- Filter to catch outgoing frames to a specific IP address: dst host
- In the case of host
, incoming and outgoing messages are recorded - Filter to catch incoming and outgoing frames on a specific port: port
- Filter to catch UDP packets on a specific port and to a specific IP address: udp dst port
and dst host - ether host
In addition to manual input, the filters can be assembled with an editor: 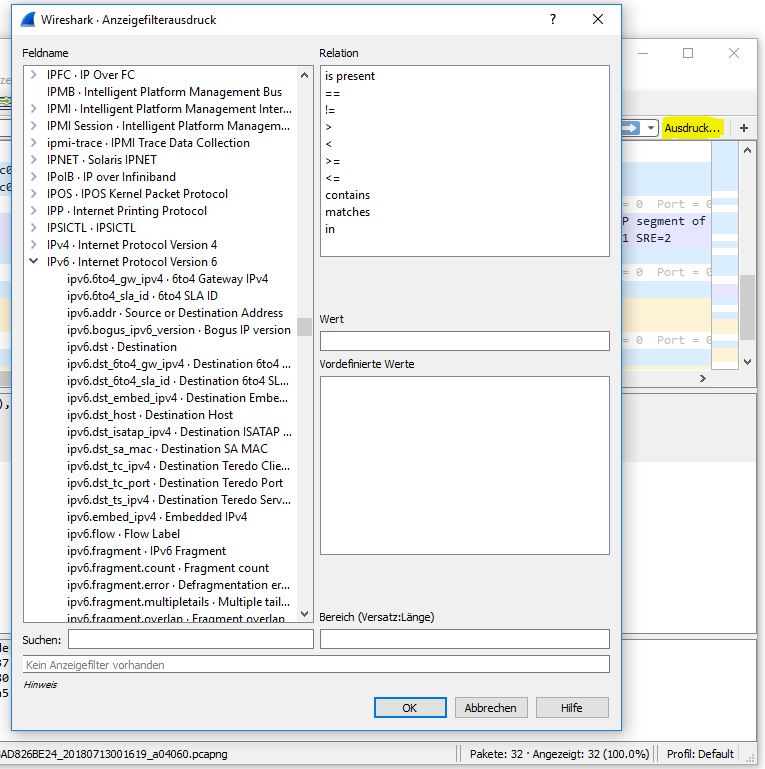
Example: Generating ICMP frames via the ’tracert’ command 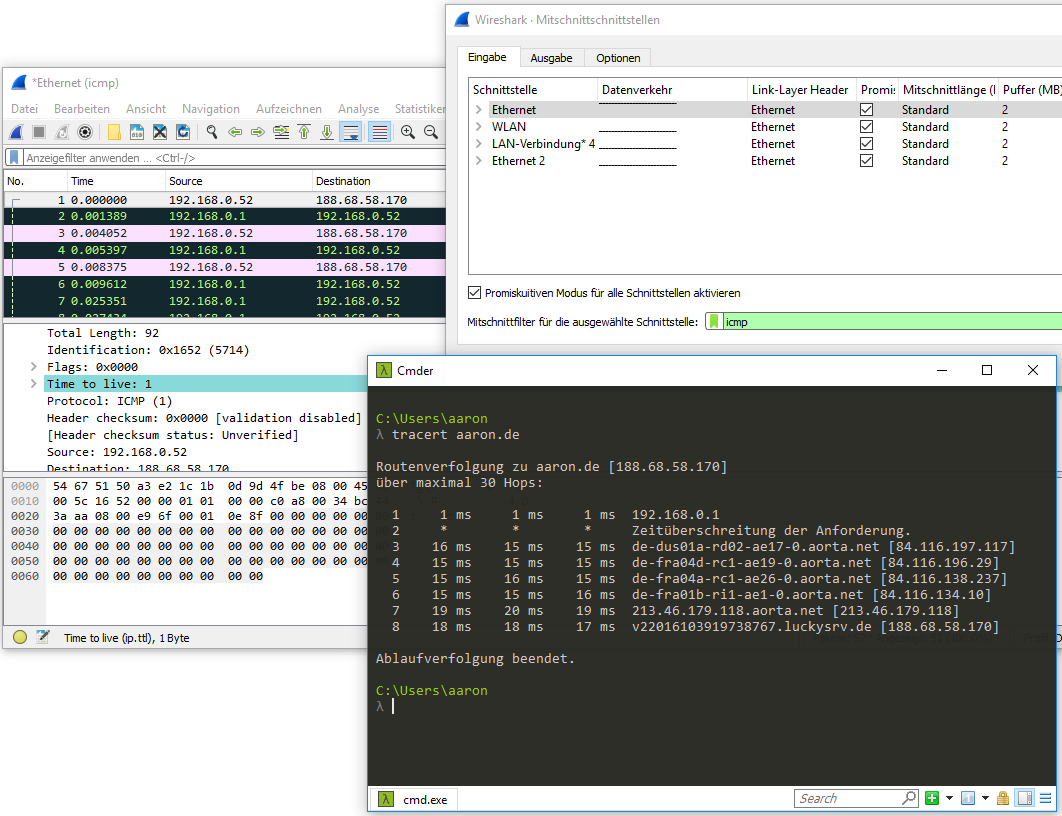
UDP The ‘User Datagram Protocol’, or UDP, is a minimal, connectionless network protocol that belongs to the transport layer of the Internet protocol suite. UDP enables applications to send datagrams in IP-based computer networks. UDP uses ports to deliver sent data to the correct program on the destination computer. To this end, each datagram contains the port number of the service that should receive the data. This extension of host-to-host transmission of the Internet Protocol to process-to-process transmission is known as application multiplexing and demultiplexing. In addition, UDP offers the possibility of integrity checking by sending a checksum. This allows incorrectly transmitted datagrams to be detected and discarded. [wikipedia]
Among other things, UDP is used for DNS queries. When executing the above example and filtering for ‘udp port 53’, we get the following output: 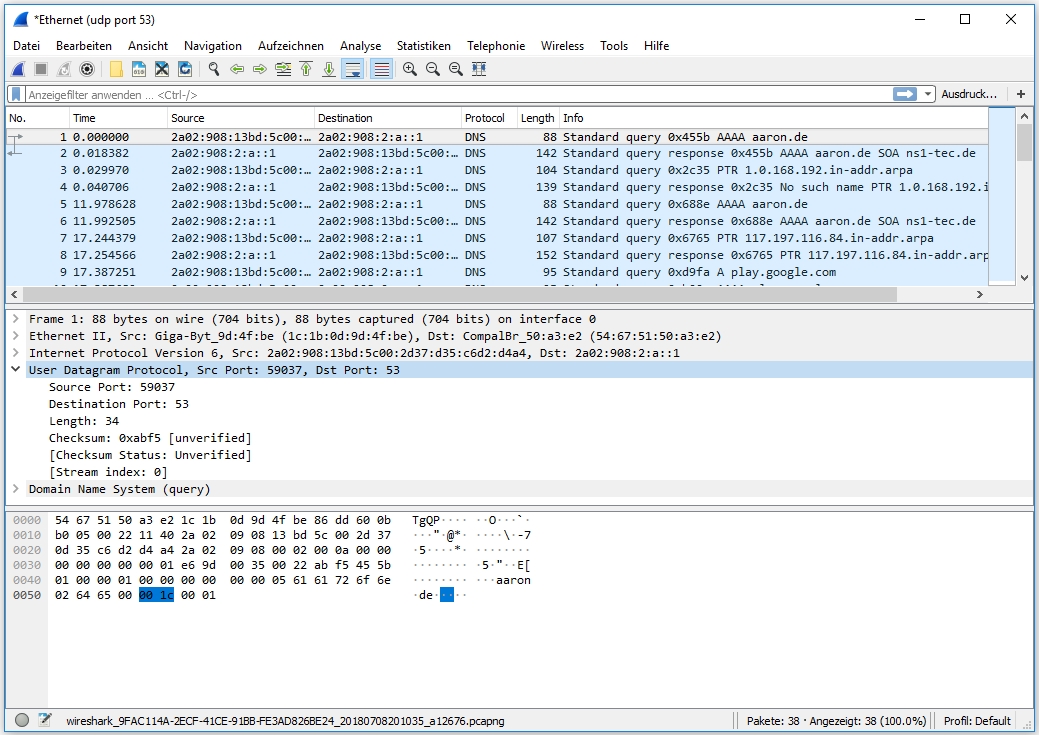 As you can see here, the UDP protocol only includes the following fields:
- Source port
- Destination
- Length
- Checksum
The entries in square brackets are additional information from Wireshark.
Furthermore, we see the structure of the frame according to OSI:
- DNS (OSI Layer: 5-7)
- UDP (OSI Layer: 4)
- IP V4 (OSI Layer: 3)
- Ethernet (OSI Layer: 1-2)
TCP connection establishment (3 way handshake) 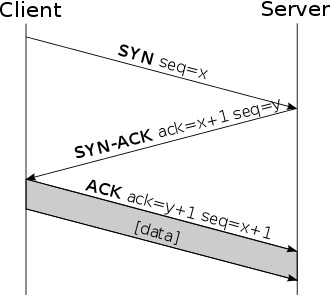 [wikipedia]
Generating TCP traffic via ‘dig www.aaron.de A +tcp’. When accessing a website, it can happen that Wireshark does not display the traffic in the correct order. 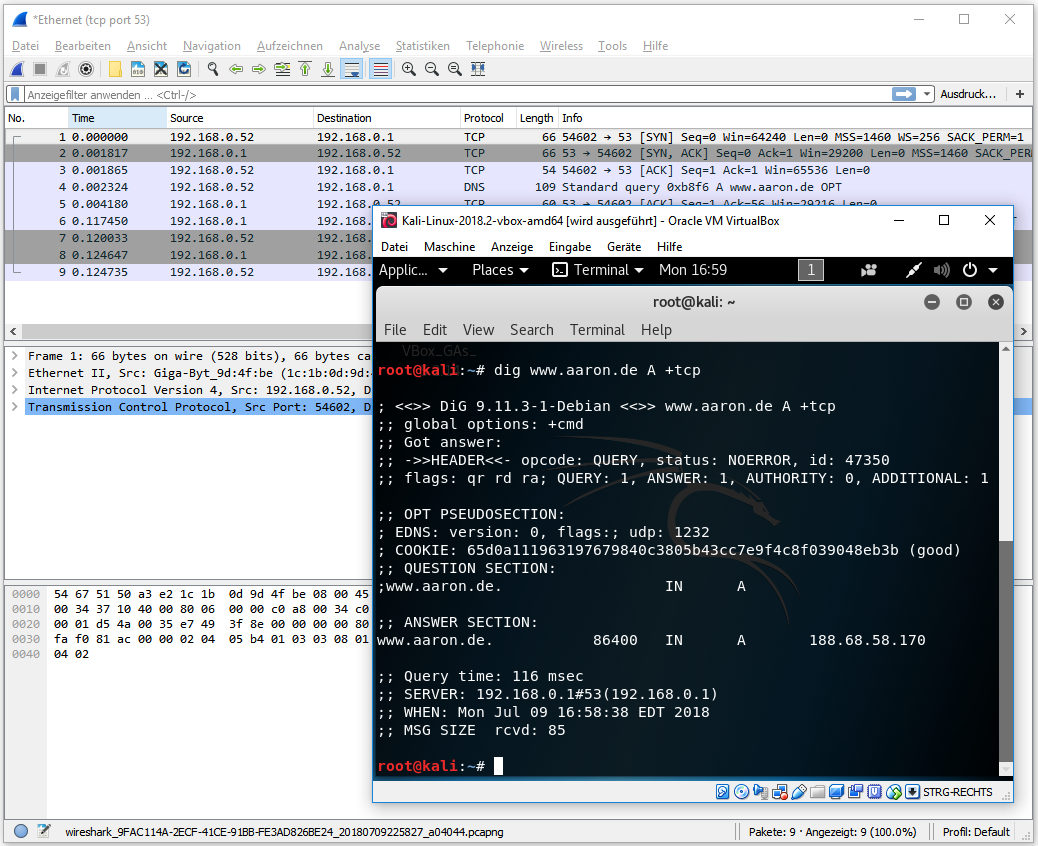
Handshake display in Wireshark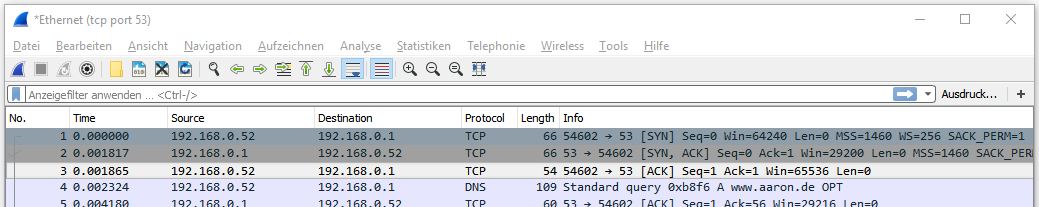 tcp port filter
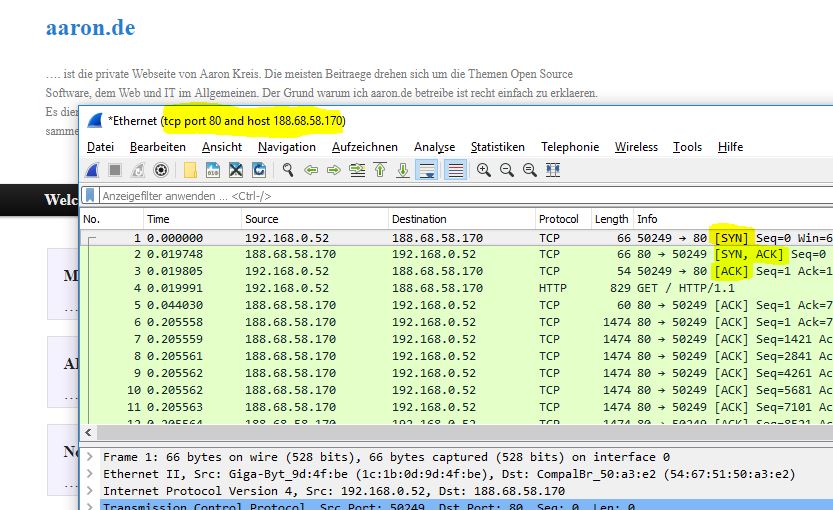 tcp host filter
In the example below, the order of the frames is displayed incorrectly. That means the timestamp is not correct. Since we know that the connection establishment over TCP starts with an ‘ACK’, in this case we can first manually search for the corresponding frame. When opening the frame, you can see under ‘Sequence number: 0’. Therefore, this frame is the first frame.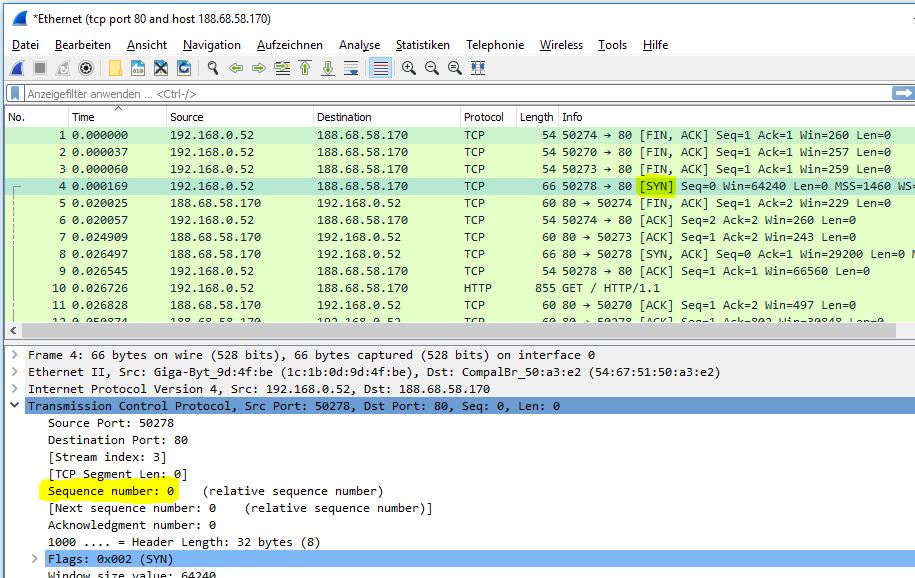
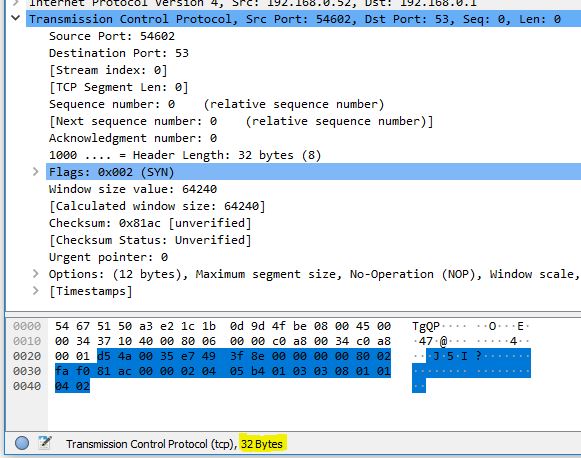
The following figure shows the first TCP frame. The first frame is a ‘sync’ request. In Wireshark, you can see how the corresponding flag was set: 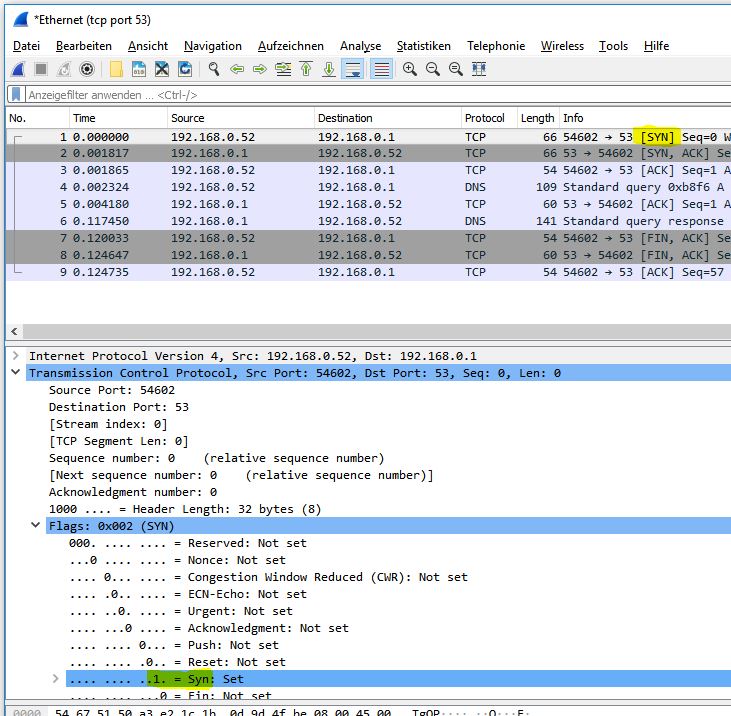
The total length of a TCP frame is 32 bytes:  When selecting the individual packet components, e.g., ‘Source Port’ or ‘Flags’, you can see the corresponding size in bytes. For UDP, the total length of the frame is 8 bytes instead of 32 bytes.
Follow stream Wireshark offers the possibility for the user to follow a protocol. In this example, I changed my password on a website via HTTP. In a public Wi-Fi without appropriate security measures, an attacker could have followed my stream in this way:
The result of the stream looks as follows: 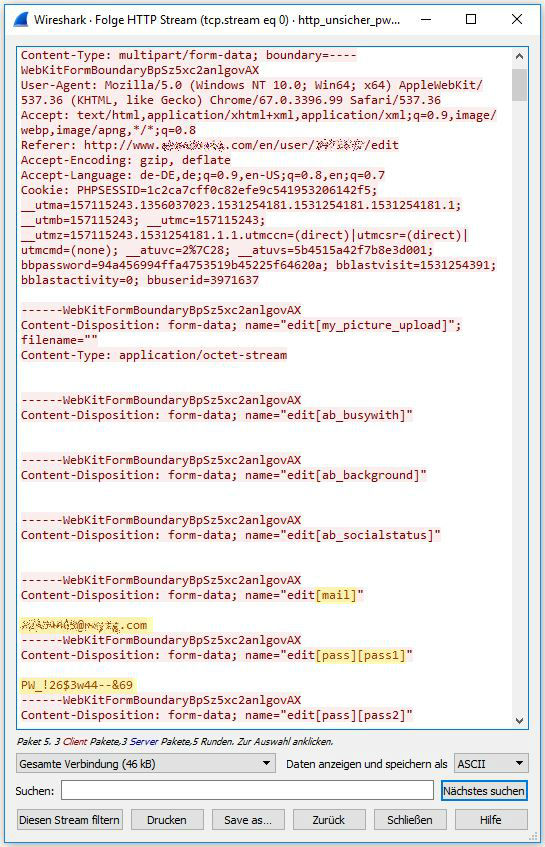 As you can see here, the email address and the test password were transmitted in plain text. Therefore, for example in a public network, you should not transmit data without appropriate encryption. The same procedure can be applied to other unencrypted connections, such as FTP.
In contrast, the capture of an SSL connection looks like this: 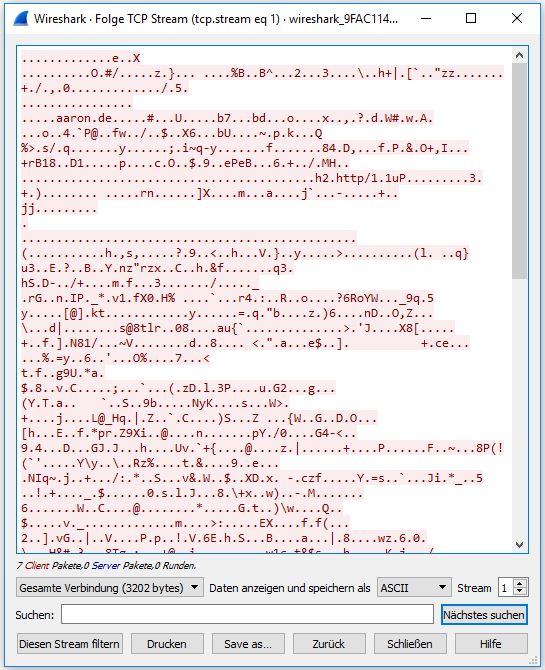
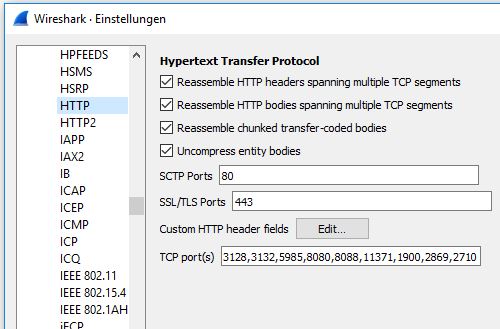
Supported protocols The list of all protocols supported by Wireshark can be found under ‘Edit -> Preferences -> Protocols’: 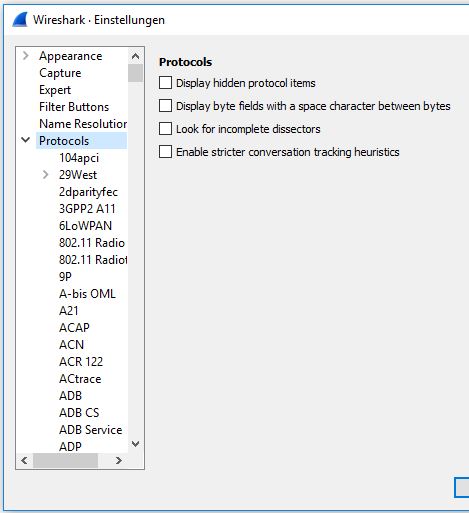
Expert information This display shows anomalies within the data transmission and can be shown by selecting the circle (bottom left). The color of the circle indicates the severity level. 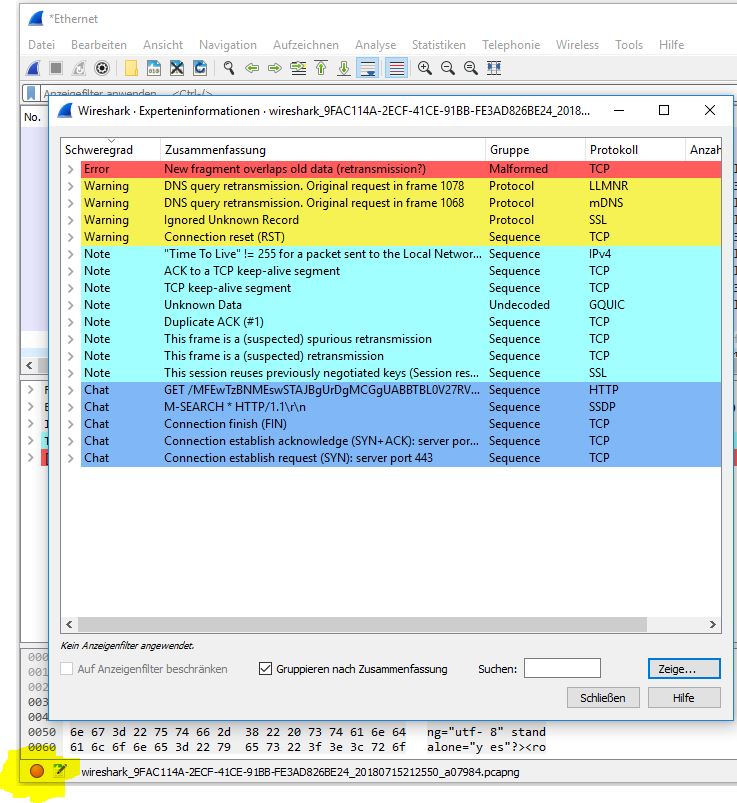 By selecting, for example, the Error row, the corresponding frame is displayed in the frame window of Wireshark and can then be examined in more detail.
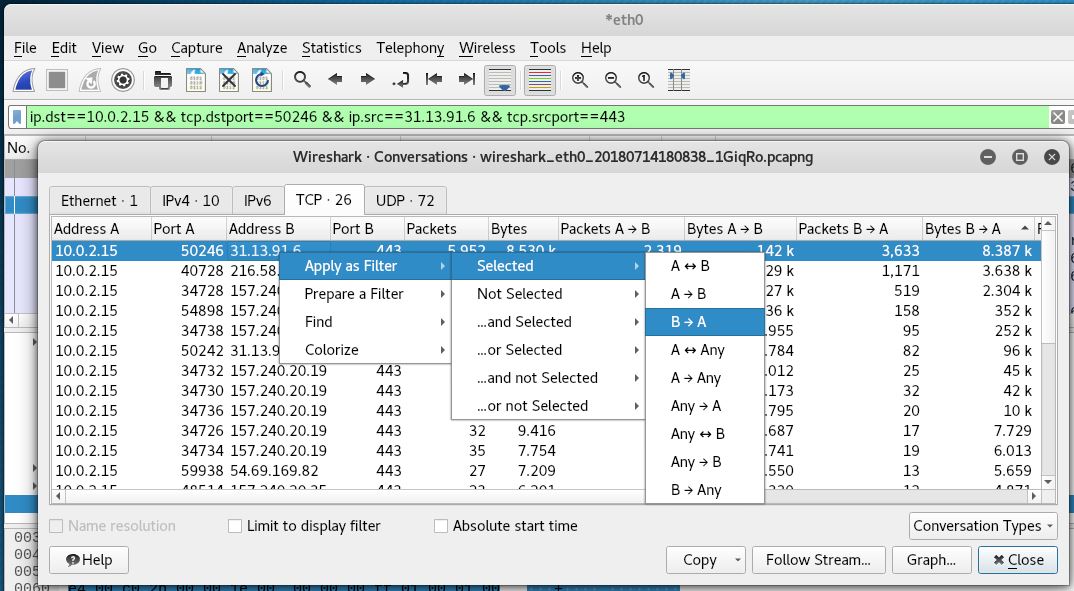
Bandwidth usage By selecting ‘Statistics -> Conversations (de: Verbindungen)’, we can list the entire traffic, e.g., by bytes consumed or number of packets. 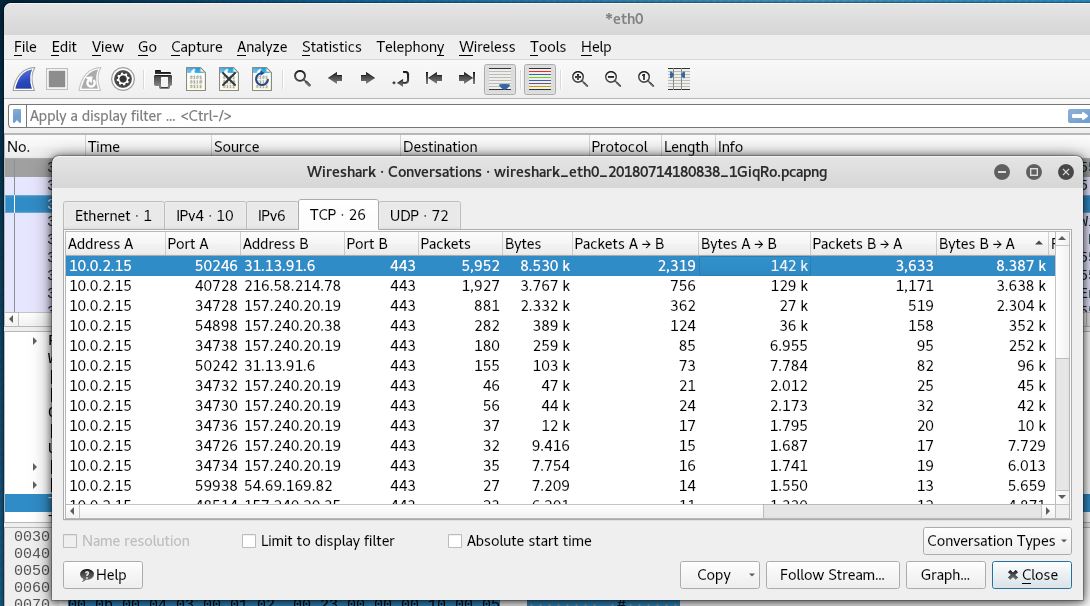
In this example, I streamed a movie in the background. Since in a stream, the traffic mainly flows from the server (B) to the client (A), I sorted by (Bytes B->A). By applying the filter shown below, only the frames that belong to the selected traffic are displayed afterwards.