Logstash
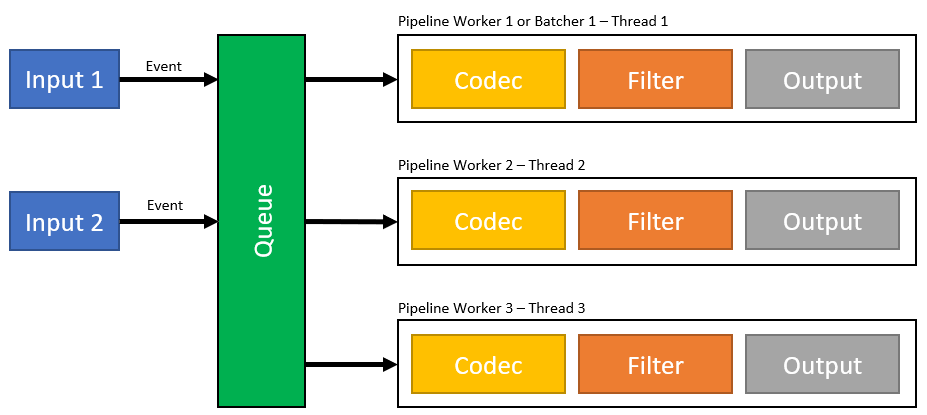
Logstash is an Event Processing Framework. With Logstach you can import data from different kind of input frameworks and sources. In the next step you can filter an modify the data and in the last step you can export the data to different kind of formats and frameworks e.g. you can read the data from a framework like Beats and forward the data to Elasticsearch for storage and further processing. Within Logstash you can process, filter and map the different input and output formats:

Logstash Preperation
Install JDK
Download Logstash *.zip
Install Postman
Install an IDE e.g. Visual Studio Code
Install XAMPP
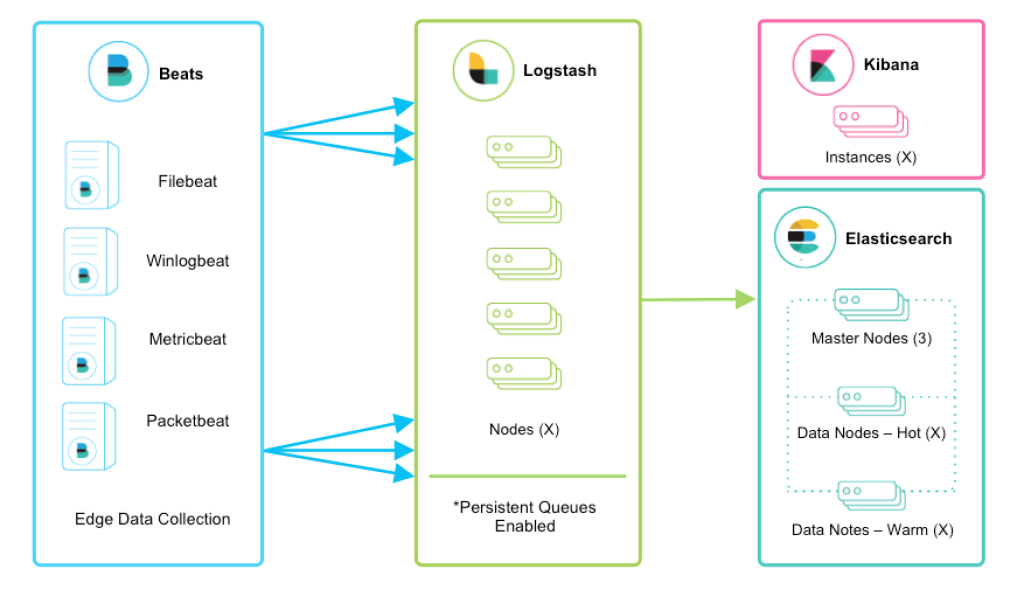
High Level Architecture of Logstash
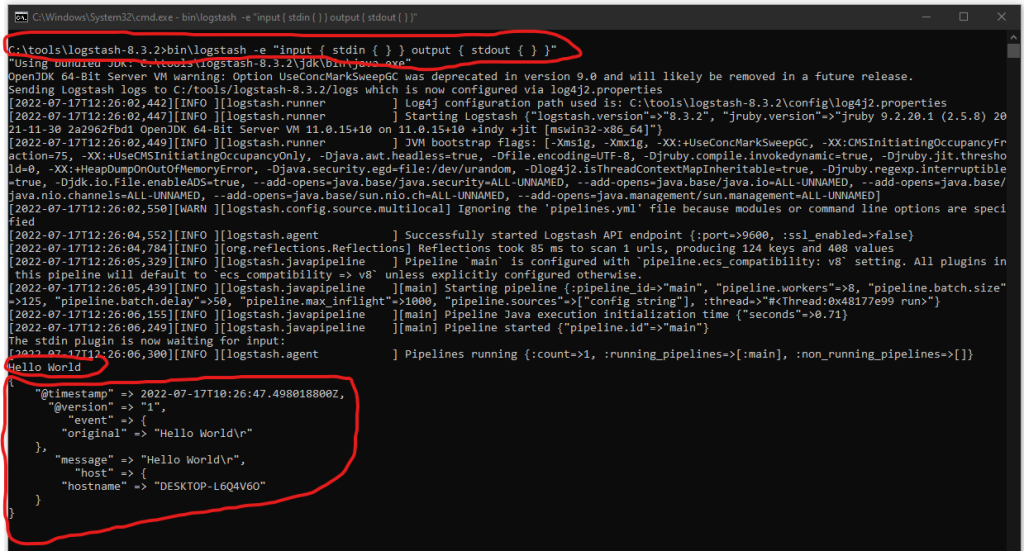
Use the following command to run Logstash with a CMD pipeline configuration. The pipeline will listen for stdin and outputs the data to stdout:
Type e.g. „Hello World“ to your CMD to see the corresponding stout.
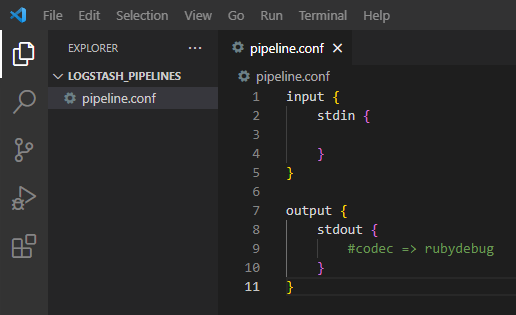
Create a new pipeline configuration:
Run Logstash by using the pipeline configuration file. Reload the pipiline after every new modification.
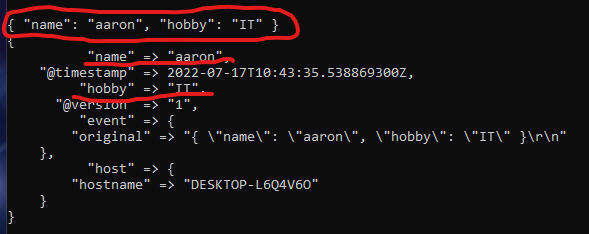
Add JSON input support to the pipeline. CMD does not support multi line JSON.
Insert a single line JSON:
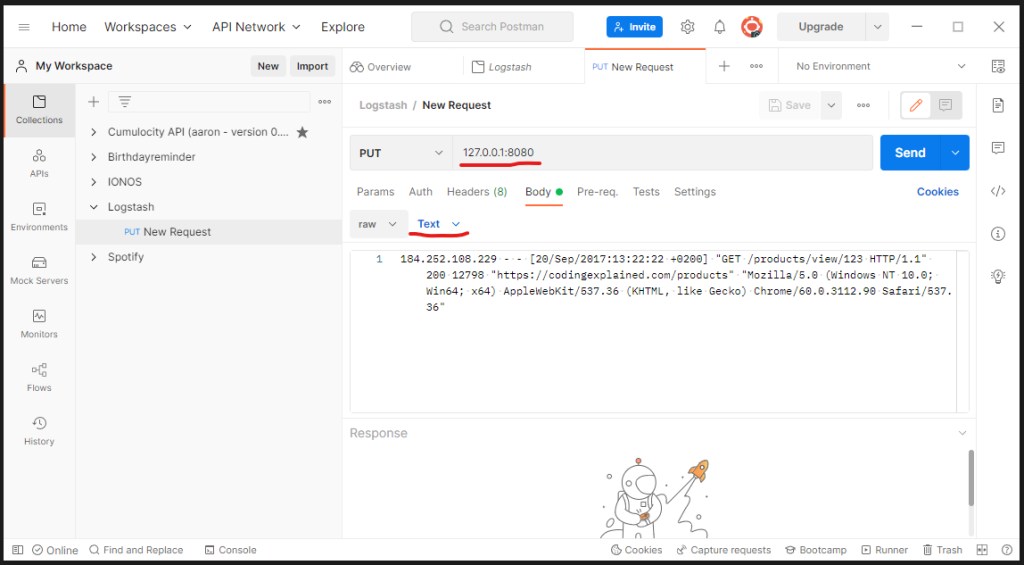
Send a new JSON request via Postman (multi line JSON support). You will see the response within your Logstash stdout.
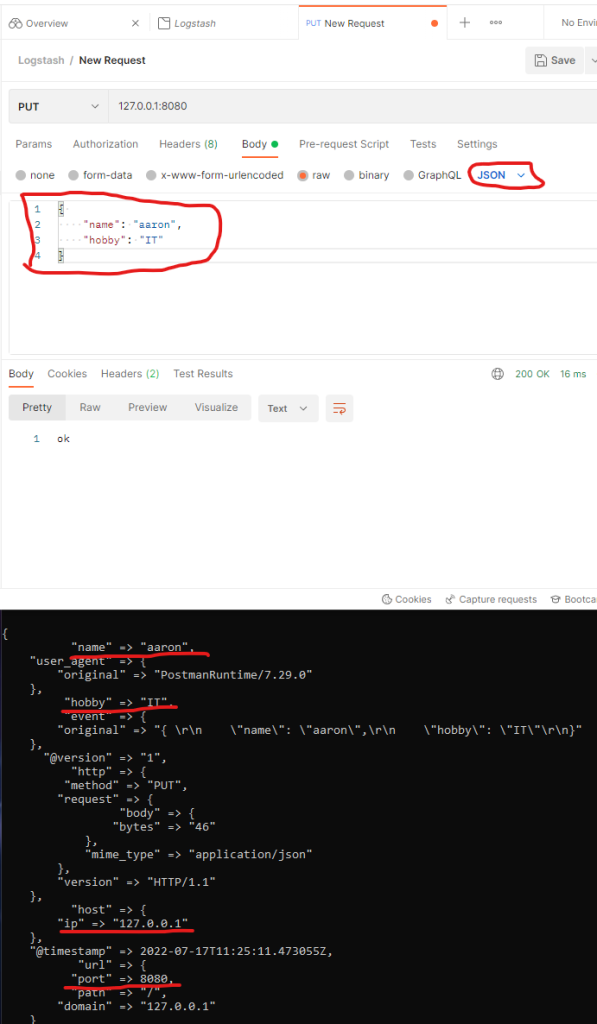
Write stdout to an external file:
Support also incoming HTTP requests:
Use the „mutate“ pipeline filter plugins to convert incoming data e.g. String to Integer. Let’s change the PLZ from String to Integer:
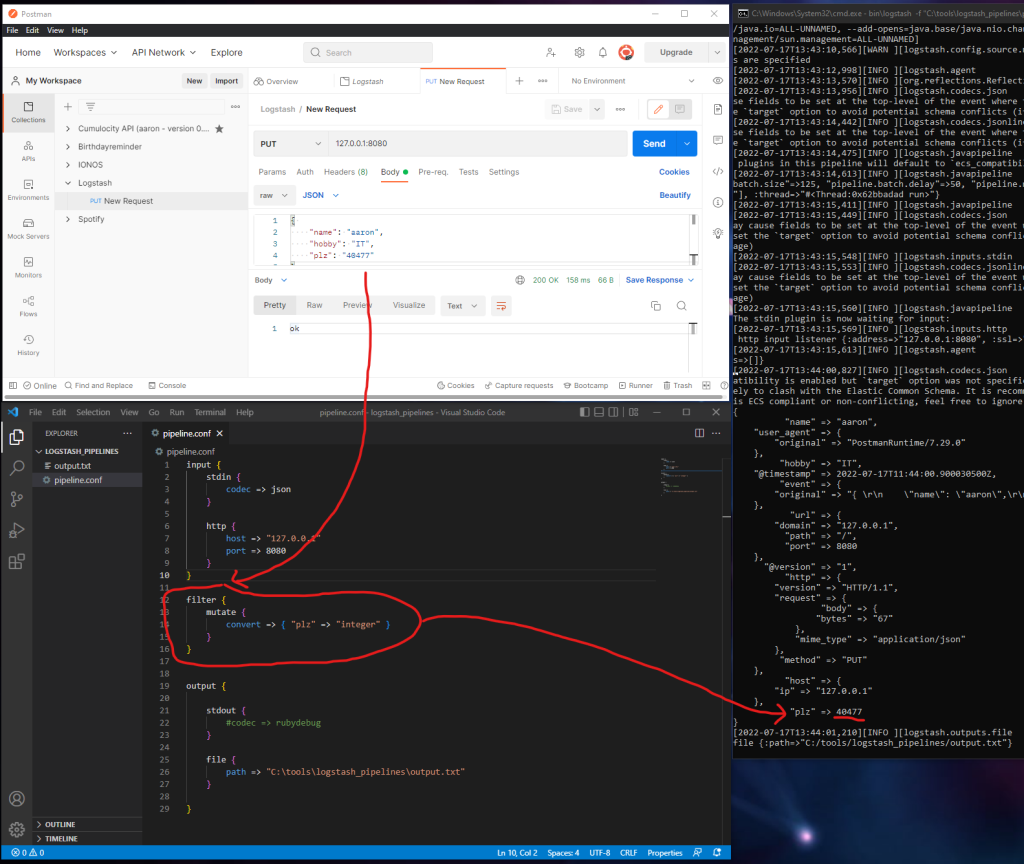
Check the following link for more mutate filter plugins:
https://www.elastic.co/guide/en/logstash/current/plugins-filters-mutate.html
Apache
Next I want to read the Apache logs instead of generating the inputs by myself.
Start Apache via XAMPP to process the Apache logs via Logstash:
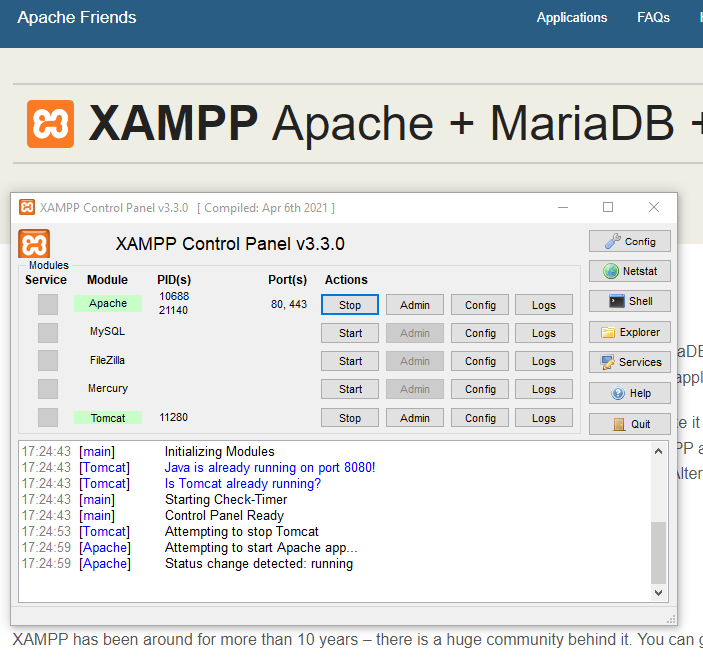
We are going to process the access.log file within the apache logs folder:
C:\xampp\apache\logs\access.log
Let’s create and run a new pipeline file called pipelineApache.conf
This pipeline is able to read the apache access.log
Run the new pipelineApache.conf file:
Grok Project
Use predefined pipeline plugins to handle e.g. the apache access.log by using the Github Project „logstash-patterns-core“ which is using the Grok pattern filter.
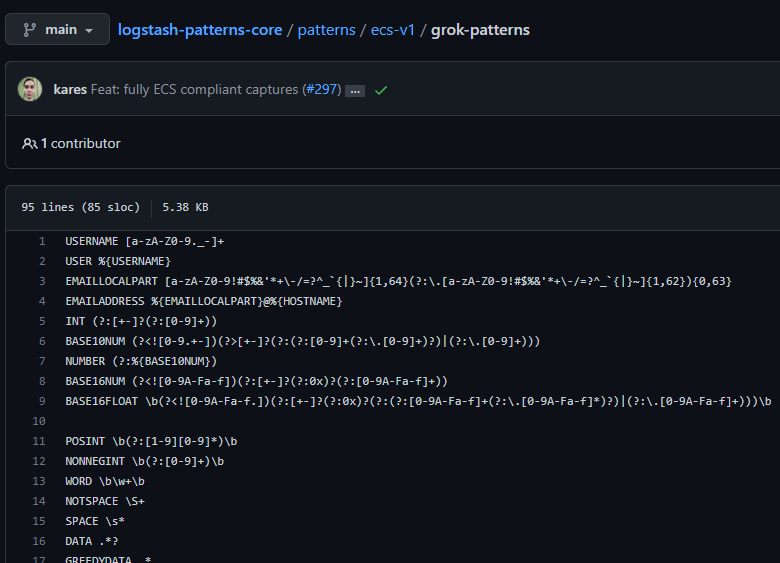
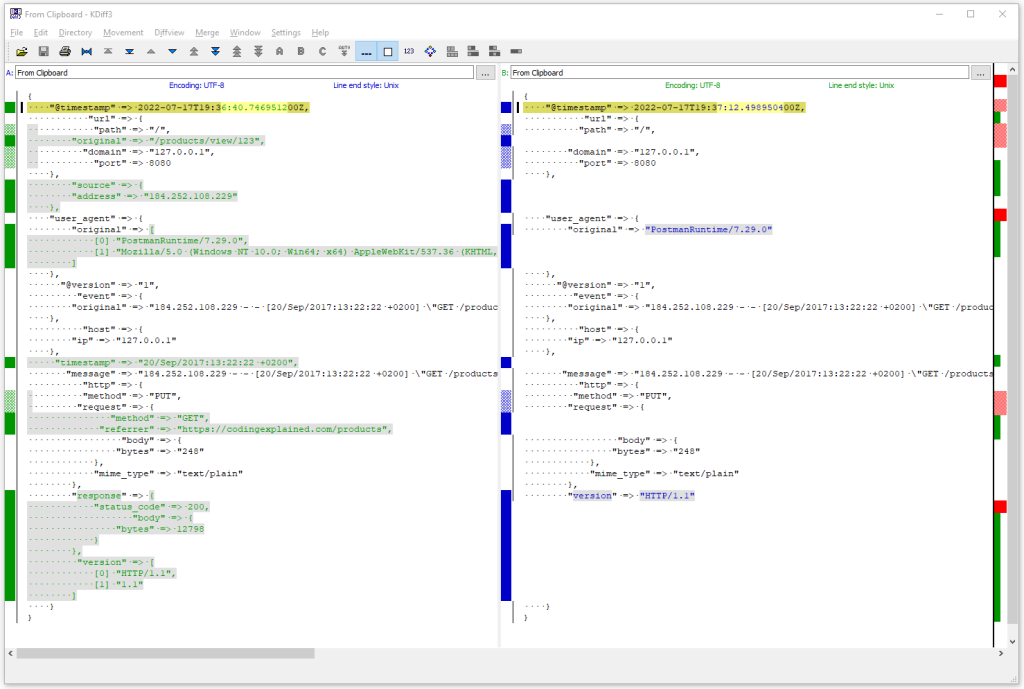
I will send the following request vis Postman to the new pipeline to test the grok filter:
The grok filtered response resp. stout is on the left side. On the right side you can see stout without using grok:
Beats
Till now we used the file input of Logstash to read the logs resp. input data:
Now we are going to use Beats agents to collect the needed data e.g. filebeat to collect logfiles and to send the data to the output sources or for futher processing e.g. to Logstash.
Check the following link to get more information about the different kind of Beats: https://www.elastic.co/guide/en/beats/libbeat/current/beats-reference.html
By using beats we will move the whole input handling process out of Logstash. From now on Logstash will only be used for data processing e.g. extracting and manipulating. By using Beats we can move Logstash to an different server (distibuted architecture).

Preperation
In the default setting, Filebeat will transfered the data to Elasticsearch. Instead we would like to send the data to Logstash:
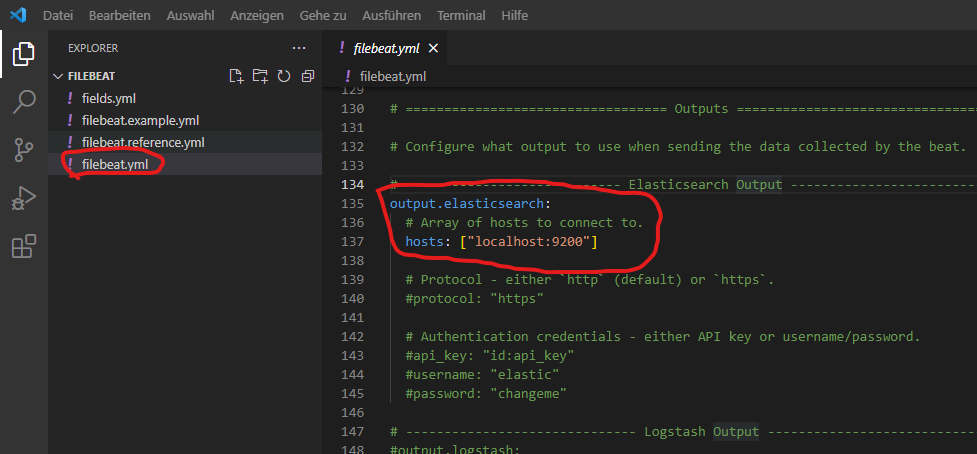
Forward the Logs to Logstash instead of Elasticsearch:
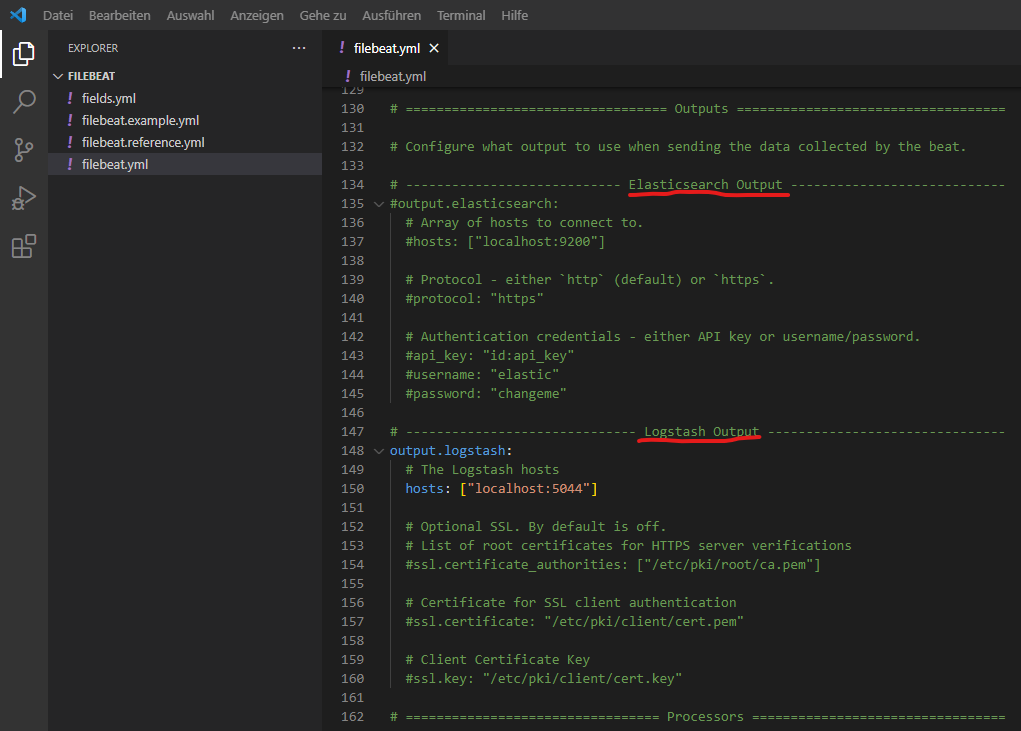
Further changes within filebeat.yml:
Check your modifications:
Apache
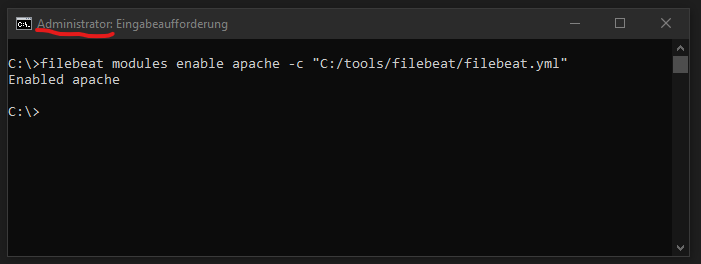
In the next step we are going to configure Filebeat to get the Apache access.log. First of all we need to active the filebeat apache support:
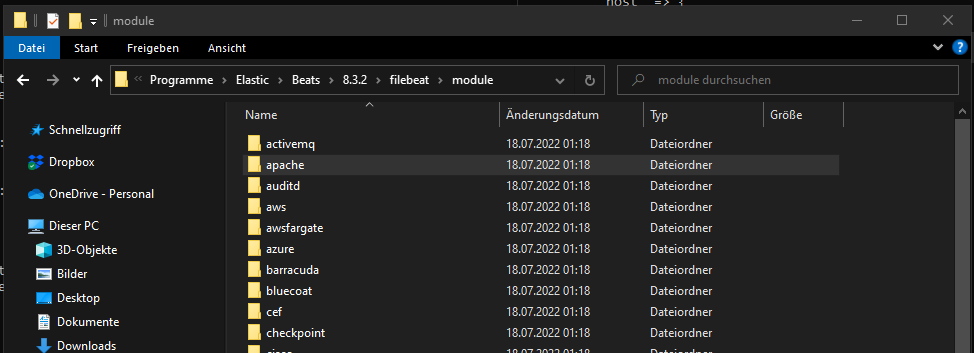
Check your local folder for all the available modules:
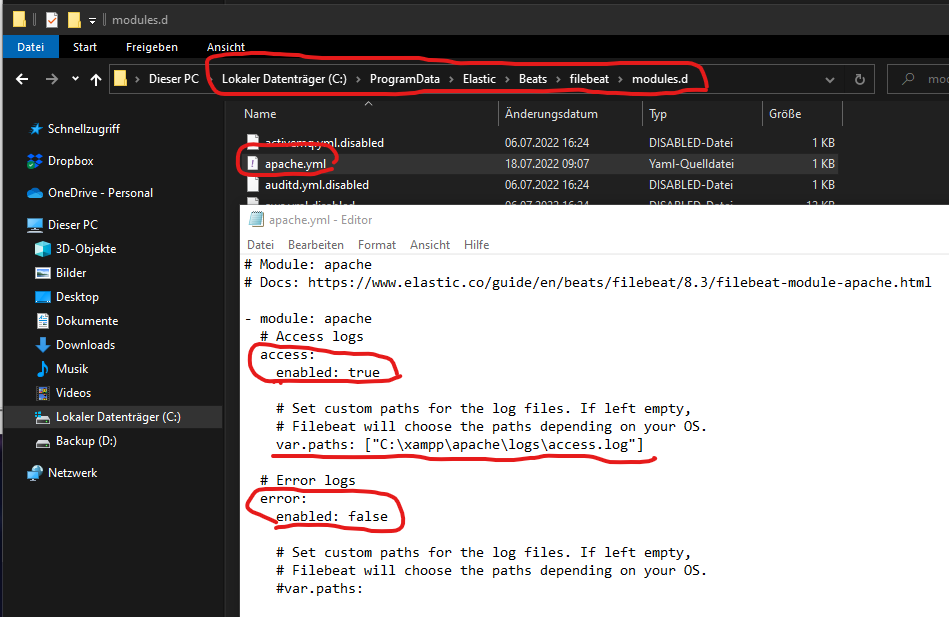
Remember we are using XAMPP Apache. The default path of Apache within the Beats configuration does NOT work for the XAMPP installation:
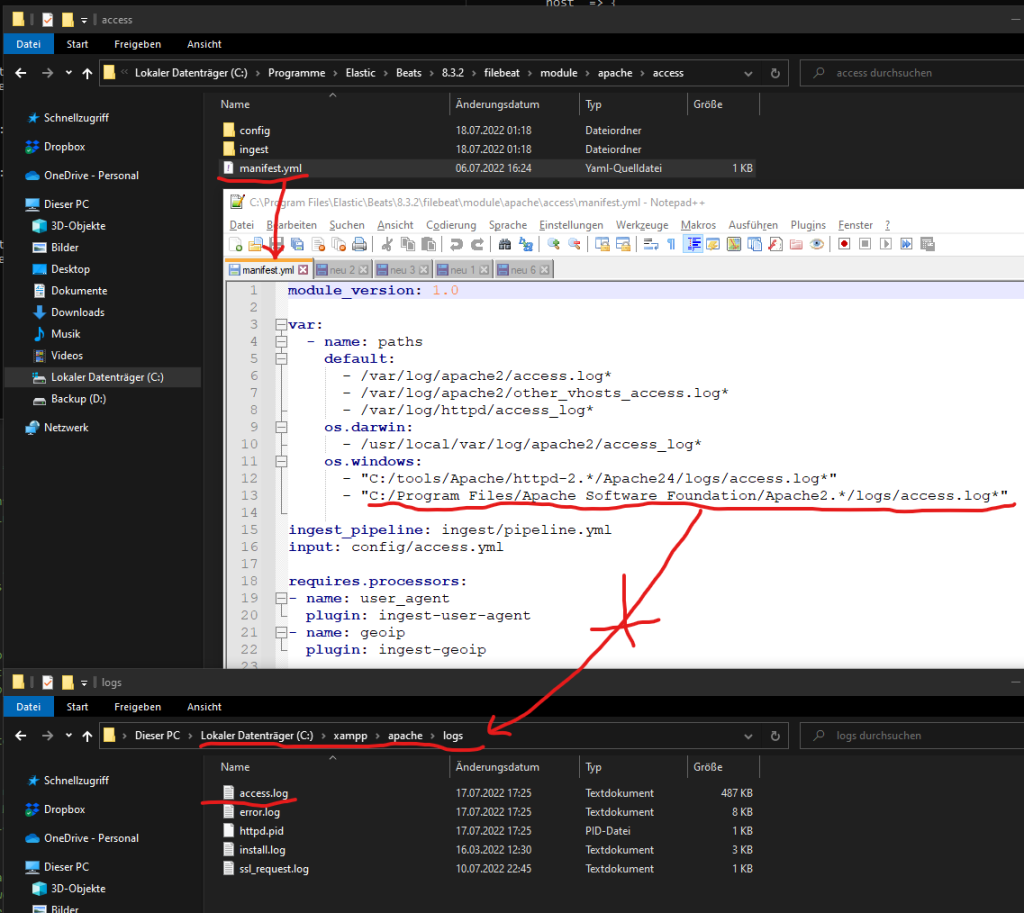
It is NOT possible to change the defalut path of the access.log inside of the file above (manifest.yml). Instead we need to open the following apache.yml to override the default path of the Apache access.log file. We have also enabled the access.log support in the same step:
Logstash preparation
The next step is to configure the Logstash pipeline to allow and process the incoming log data (apache access.log) from Beats. You will find the list of all pipelines which will be loaded within pipelines.yml:
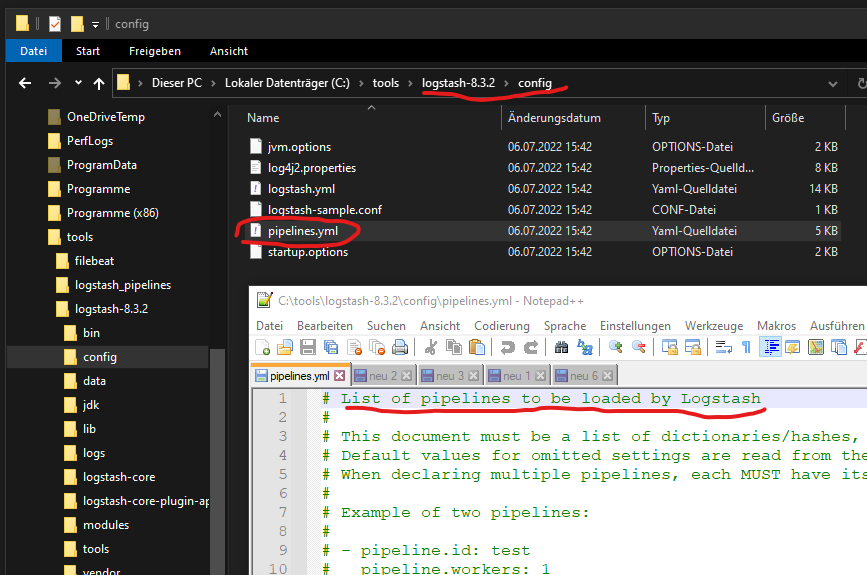
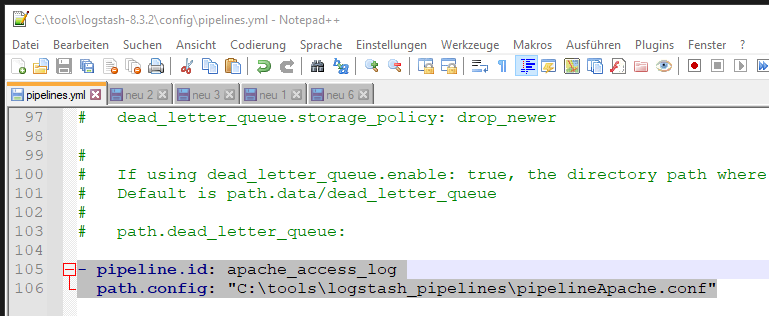
Add the following lines to pipelines.yml to load your own Logstash pipeline configuration file:
Starting Beats
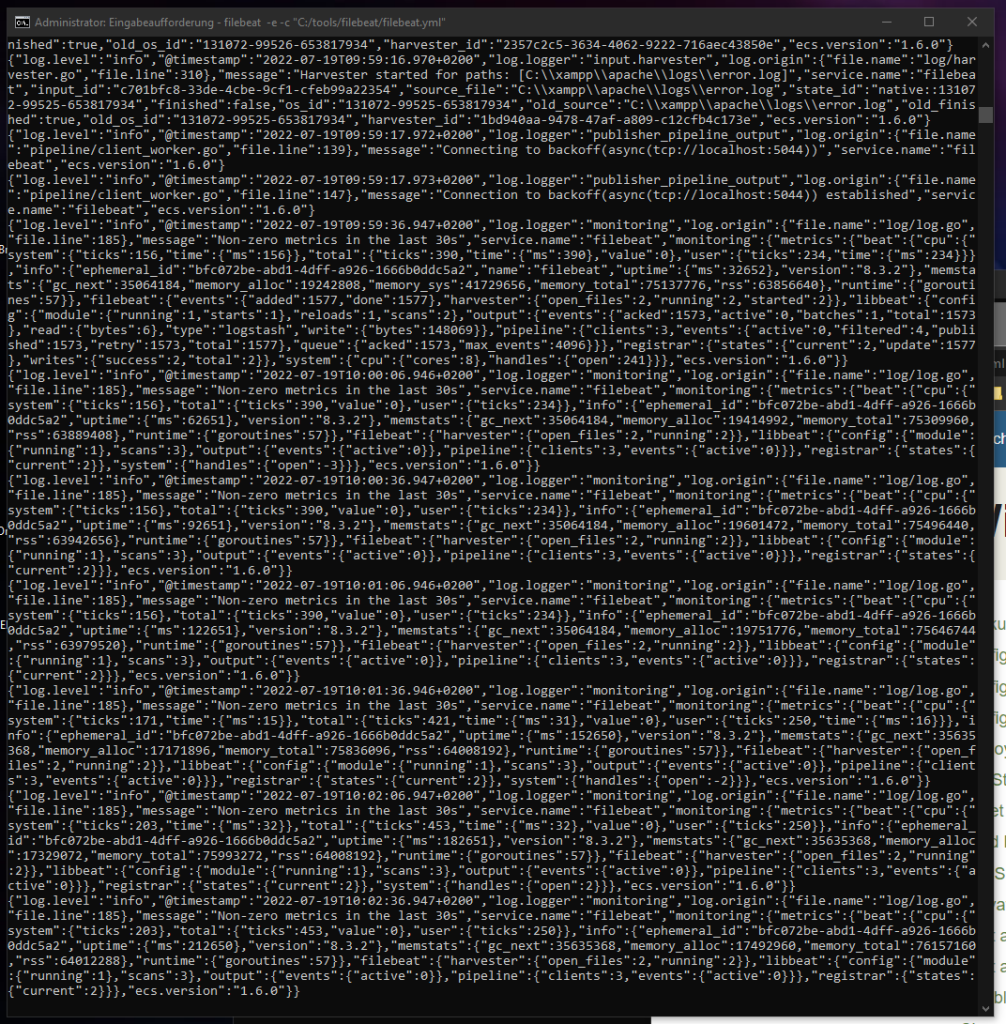
Filebeat is now going to forward the apache access.log to Logstash.
Let’s deactivate the „Non-zero metrics in the last 30s“ message that is going to annoying me.
Add the following line to the filebeat.yml:
The new Logstash pipeline „pipelineApache.conf“ will be changed like the example below:
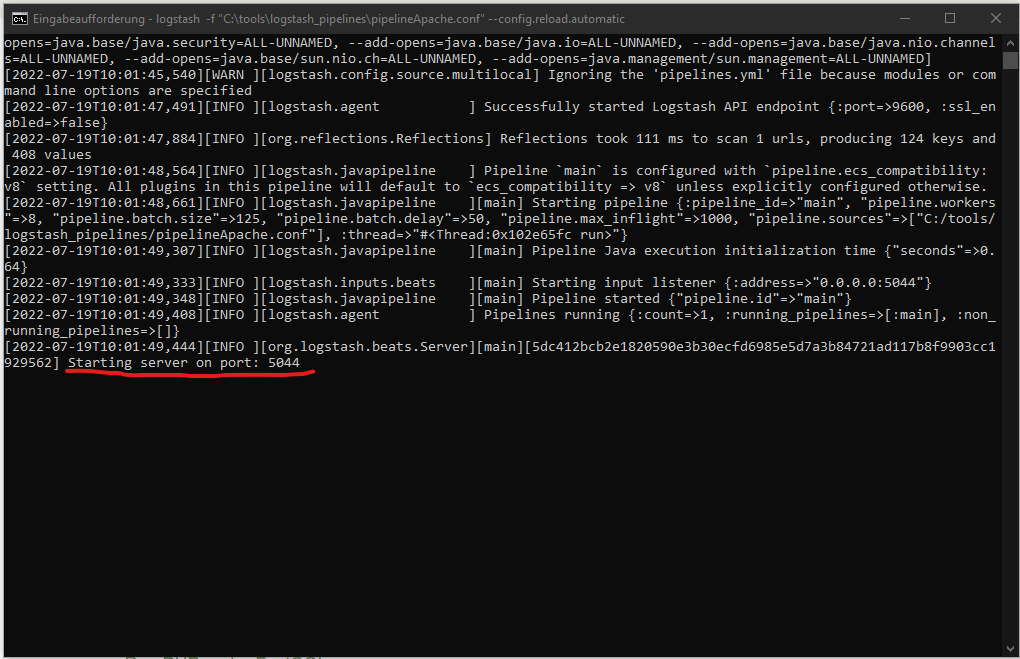
Start the new pipeline (pipelineApache.conf):
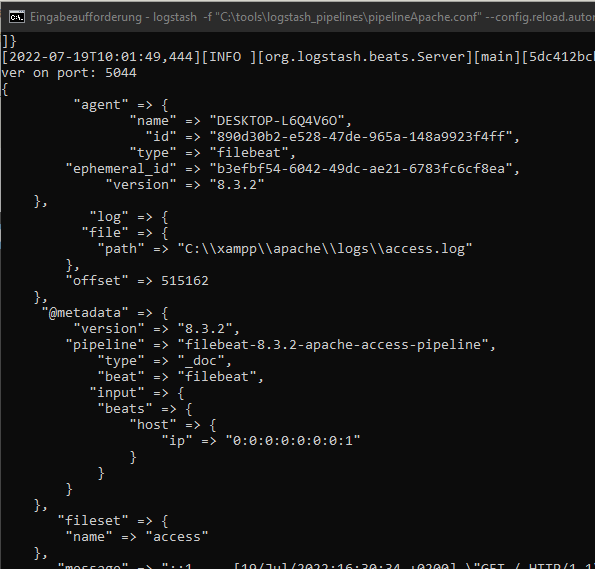
Logstash is now listening to the incoming Apache logs date from Beats:
Open one of your Apache pages to transfer the new access log from Filebeats to Logstash:
Currently you need only this two commands to start Beats and Logstash:
1. Run Filebeat as CMD Admin: C:\>filebeat -e -c „C:/tools/filebeat/filebeat.yml“
2. Run Logstash: C:\tools\logstash-8.3.2\bin>logstash -f „C:\tools\logstash_pipelines\pipelineApache.conf“ –config.reload.automatic
Elasticsearch
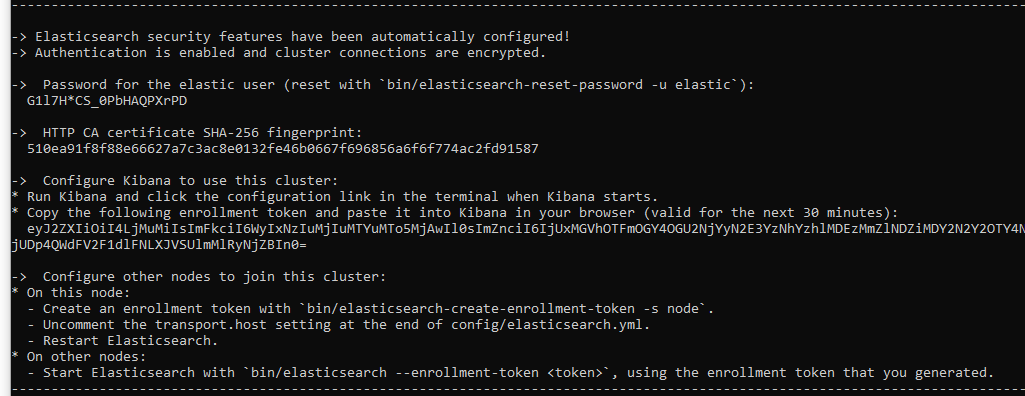
Run Elasticsearch
This command will also generate all needed credentials. The Kibana Token is only available for 30 min.
Kibana
Run Kibana
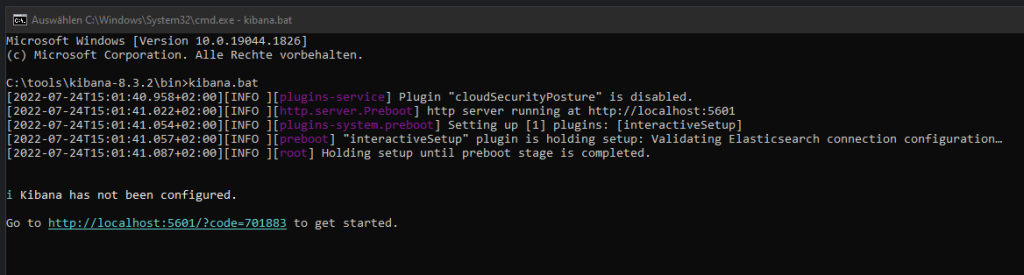
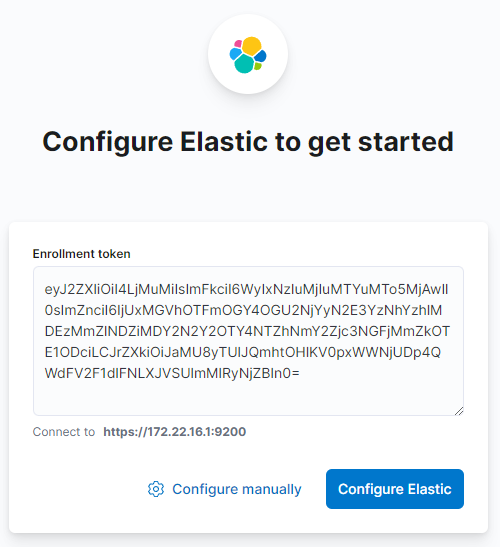
Open Kibana and insert the Kibana Token generated by Eslaticsearch:
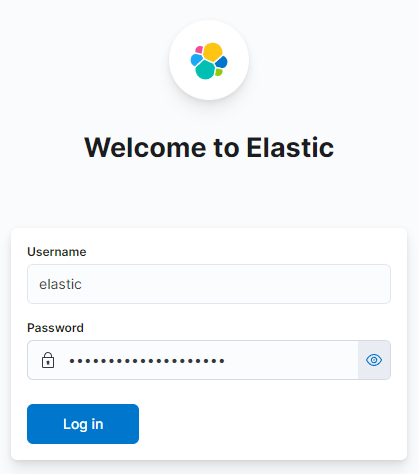
Credentials has been generated by Elasticsearch:
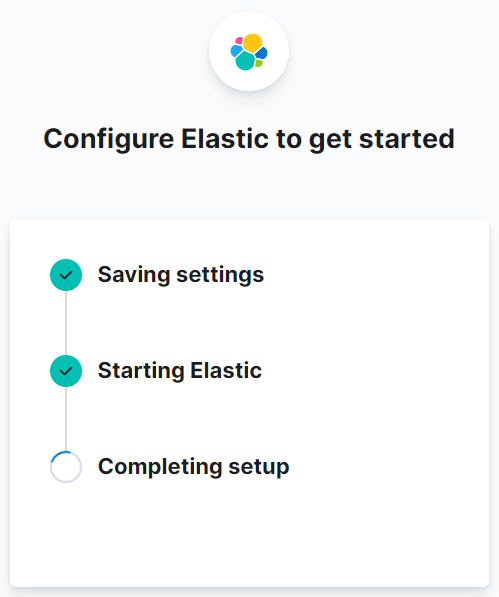
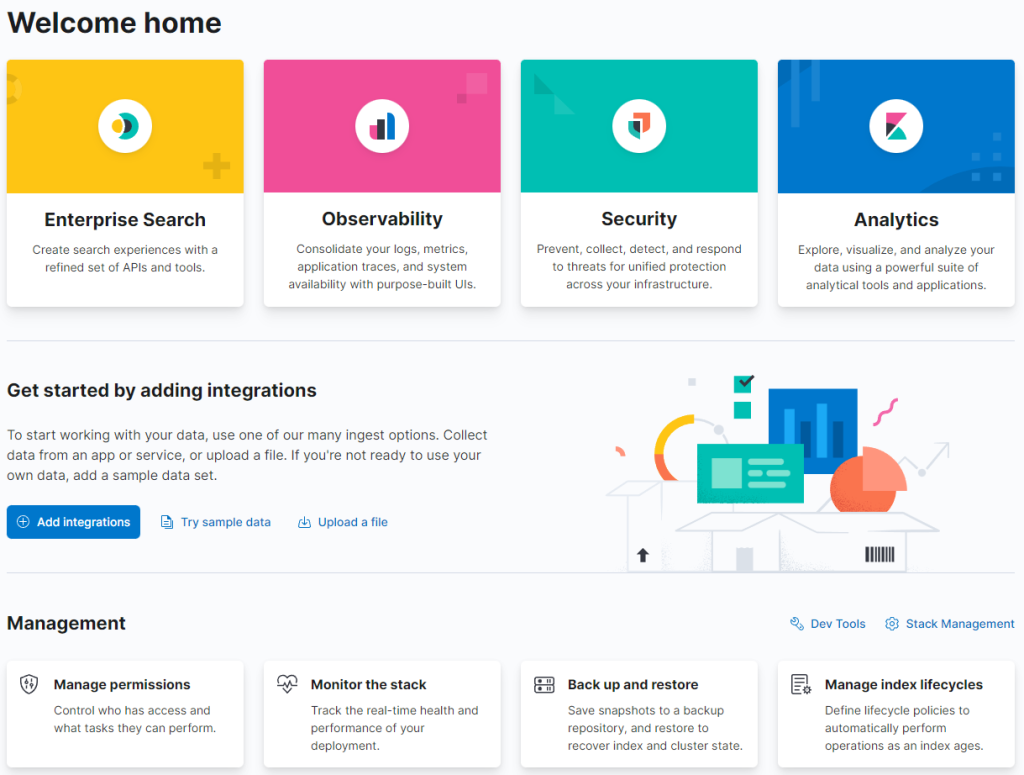
At the end of the configuration you will get forwarded to the welcome page:
Stop Kibana & Elasticsearch. We need to configure booth tools in the next steps.
Elasticsearch Configuration
Open the Elasticsearch configuration file (elasticsearch.yml) and deactivate all security features for local testing:
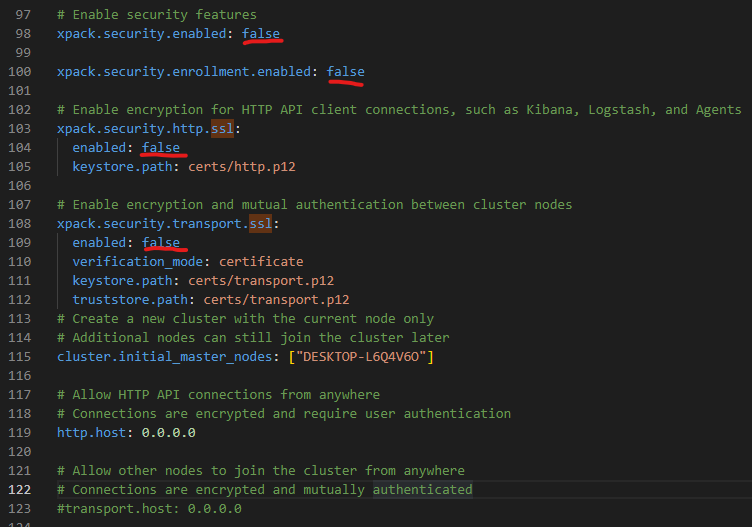
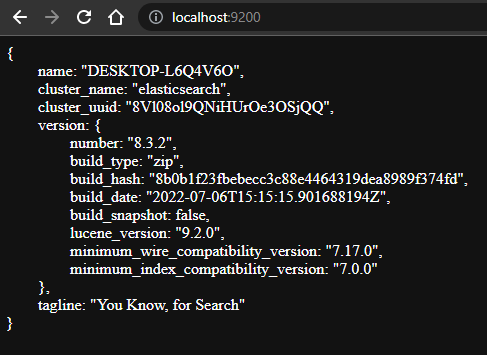
Restart Elasticsearch and check if Elasticsearch is available:
to be continued